Data Visualization Works
At NAM India
Company
MyrsaTech
Role
UX/UI Designer
Duration
2 months
Team
1 Designer, 2 PMs, 1 Business Analyst
Problem Statement
How can we devise a solution that not only acts as a roadmap for problem-solving but also aids in defining objectives, monitoring progress, and maintaining alignment within the product team to ensure clear communication?
My Roles & Responsibilities
Competitive analysis & Individual sessions with developers & business analyst to present my design concepts & assess their feasibility.
Worked alongside business analysts to comprehend project requisites, sharing my ideas & rationale for design validation.
Developed a design system & Generated numerous design iterations to approach problem-solving from various perspectives.
Design Process
Research
Problems & primary
Use Cases

Ideation
Ideas, sketches,
wireframes

Visual Design
Designing the Interface,
user flows and build prototypes.
Research
Conducted interviews with both current and former client managers, as well as their teams, to gain insights into the challenges they encounter before and after project completion.
These significant pain points were identified, leading to a decision to address & resolve them.
The roles in organization aren’t clearly defined,
and team members are working across the board.
Everything needs doing, and you don’t know
what you should do first.
Processes and systems aren’t well established yet,
so project on the brink of chaos.
To allocate time and resources for
work that is impactful.
Metrics to be measured
Based on the pain points, we discussed the metrics that we must capitalize for:
Core Metrics: To decrease time it takes to make a vison document.
General Metrics: To increase task success rate & decrease task completion time.
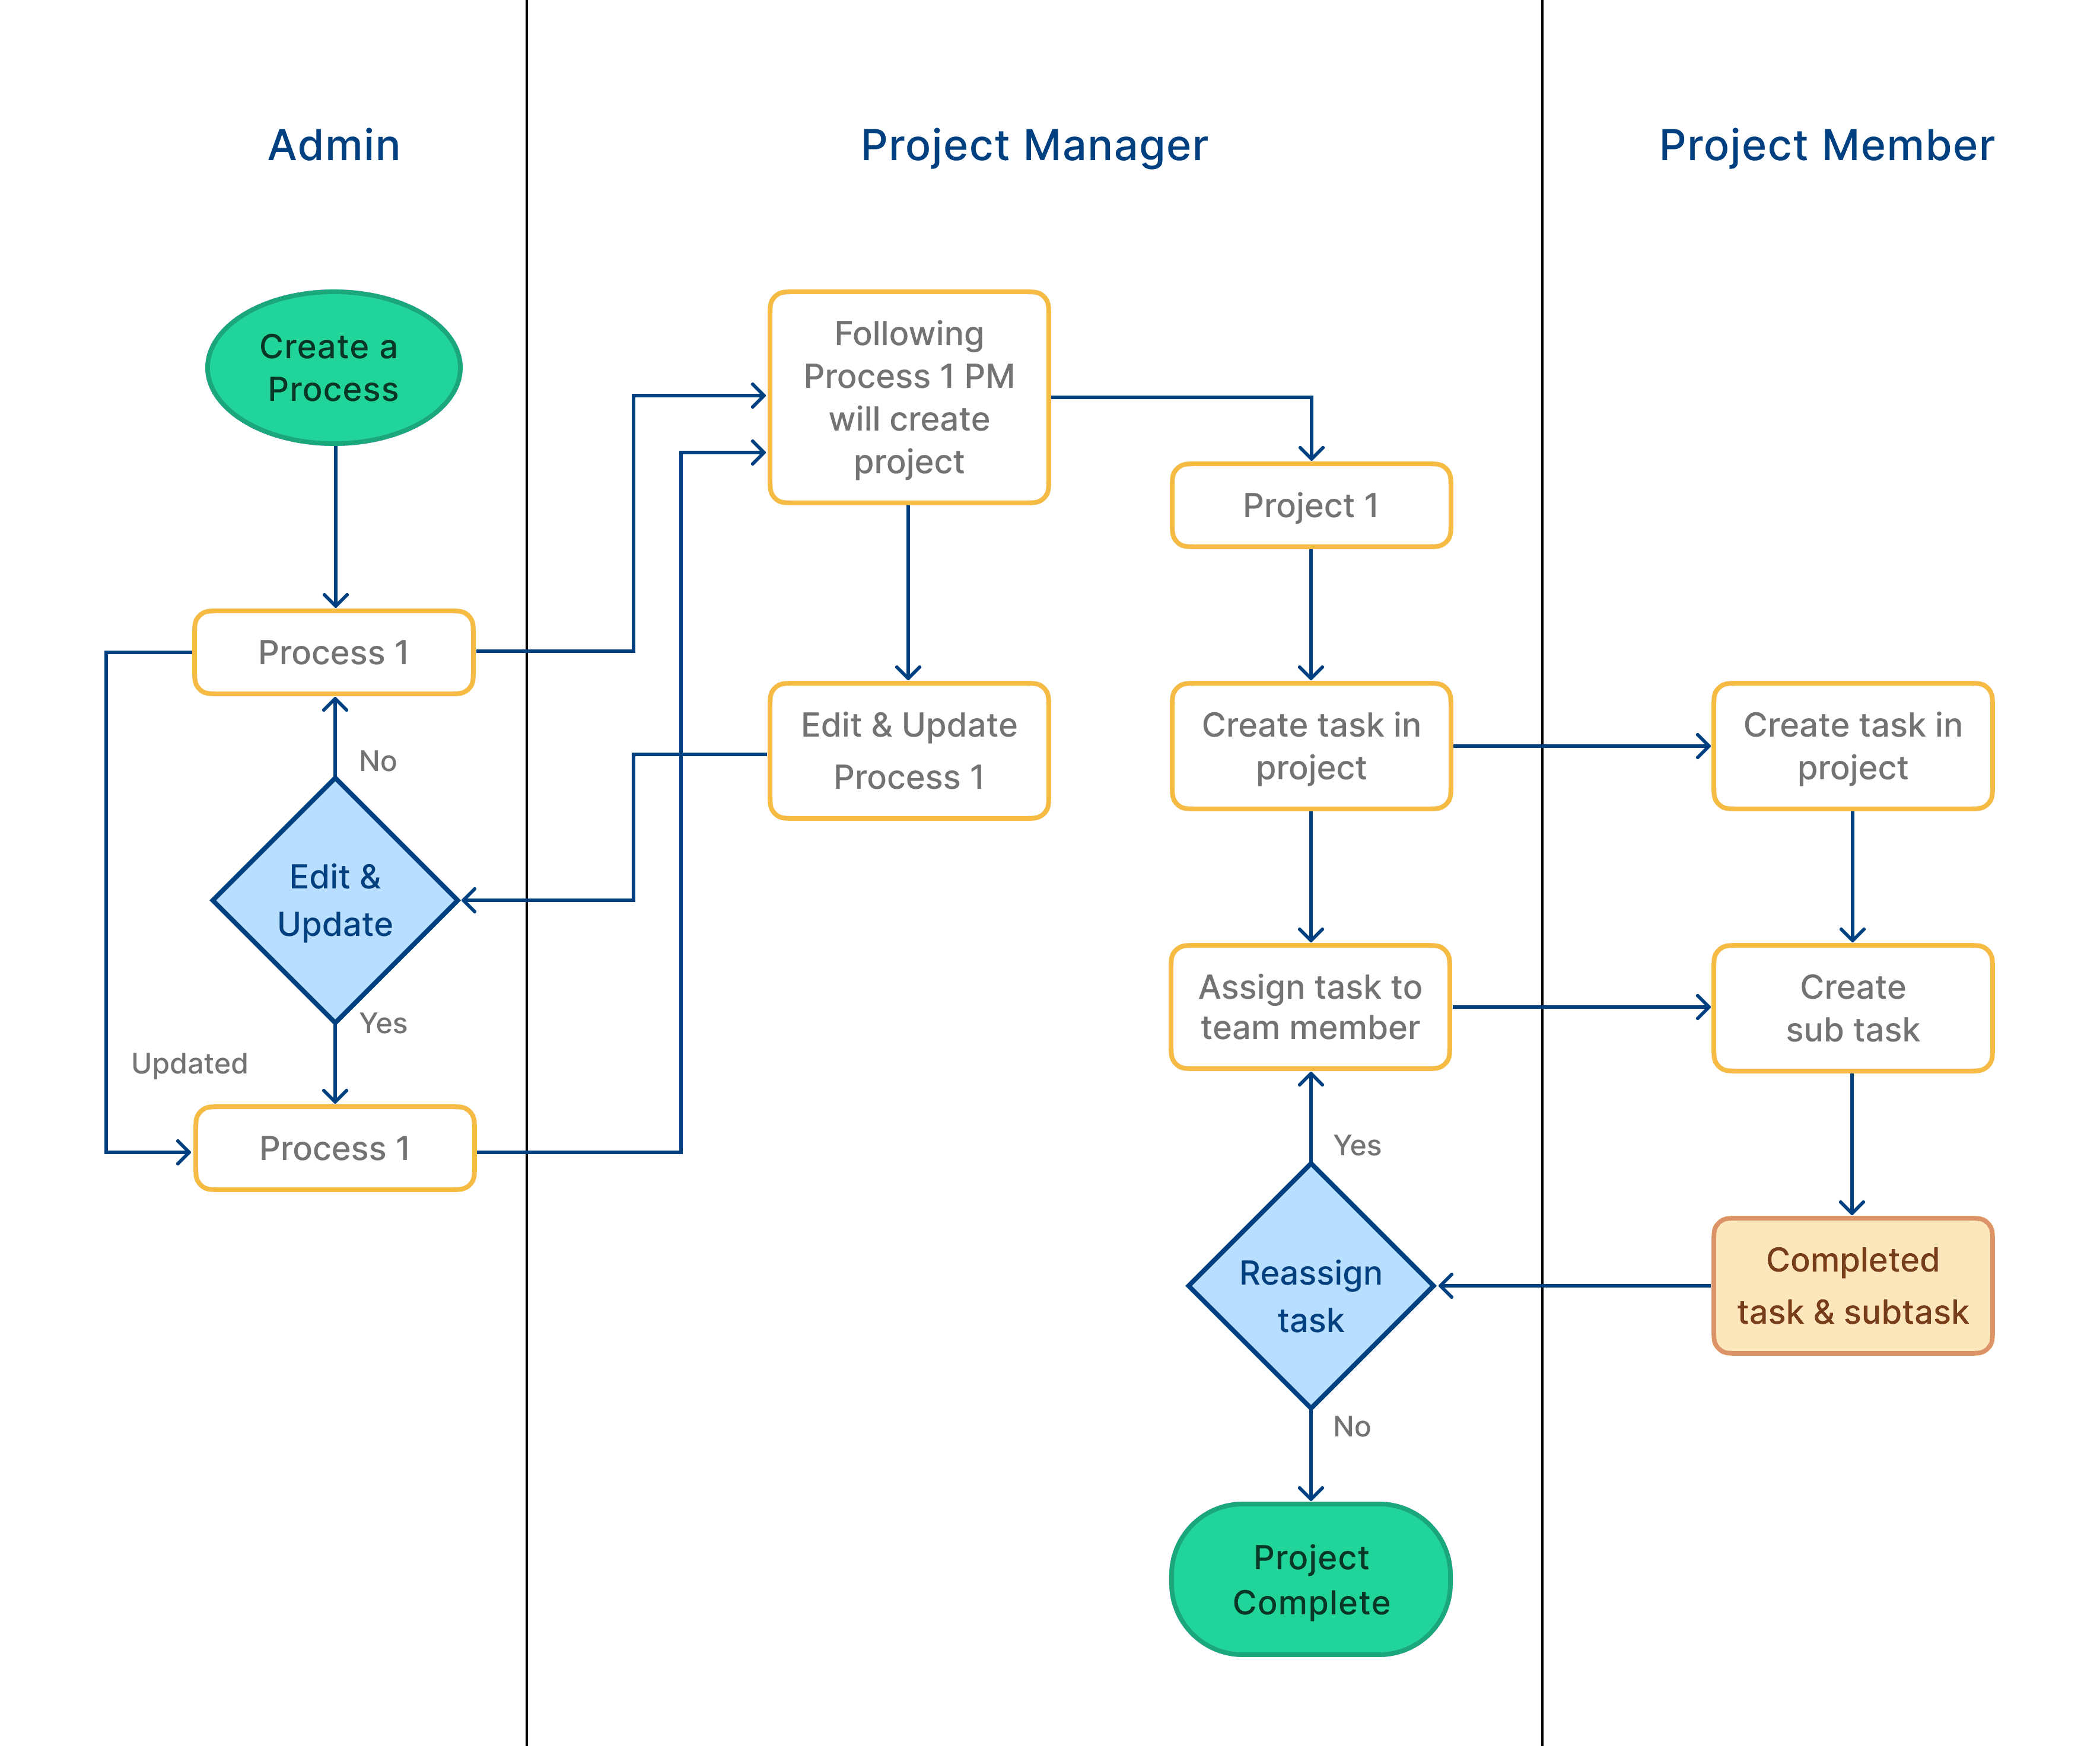
Logical User Flow
Initiated the design with the creation of user flows, which were consistently revised as we pinpointed additional edge cases. These user flows formed the cornerstone of the design journey.
Ideation
The onboarding process encompasses familiar patterns like login, a walkthrough, and a user dashboard. Since this design collection is of secondary importance, I opted to commence with the simplest design scenarios.
Rather than commencing with the interface framework, I initiated the process with a tangible functionality component.
Initial steps involved compiling the most prevalent data points while establishing processes, projects, and tasks.
Given that all designs revolve around task creation and execution, they will inherently share identical data points and follow the same form progression.
Data points & their organizing groups
Label
Name
Description
Search
Labels
Tags
Sort
Priority
Color
Time
Start Date
Estimated Date & Time
Filter
Method Kind /
Status /
Visibility
Execuation Type /
Owner
Instead of commencing with an empty canvas, utilizing a Process will ensure that you remain aligned with the fundamental principles and objectives you've defined for your project.
Process
What’s a Process, and why use a Process?
More than just a roadmap. A process functions not only as a roadmap for project development but also ensures alignment within the project team, fostering clear communication. It outlines the project's domain and the essential requirements that need to be incorporated into the process.
Distinct variations. Processes can exhibit considerable variation across different domain types, and even within the same domain, what proves effective for one team may not suit another. However, they all share three fundamental elements:
Context
Exploring the user issue you aim to address.
Offering a brief overview in a sentence or two, offering team members a condensed understanding of the product and its significance to end-users.
Goals/Sub process
Formulating sub-processes in order of their importance to maintain a concise list.
Dividing tasks into subtasks and outlining the necessary elements, including milestones, KPIs, and success metrics.
Dependencies
Note down the essential functional requirements necessary for your product to effectively address the outlined problem and detail what your team needs to achieve or acquire.
Created multiple versions of iterations
Version 1:
Wireframes iterations with data points
Iteration 1
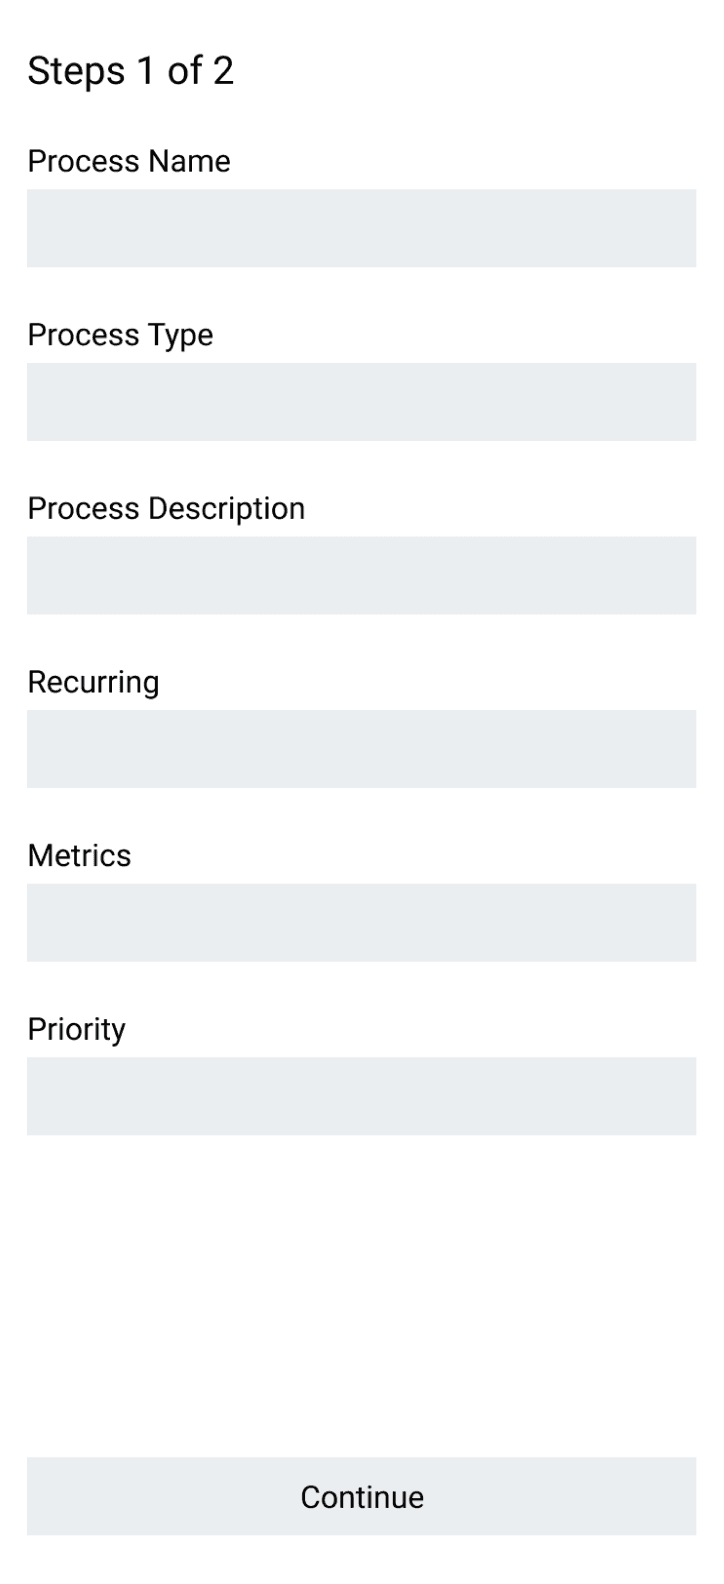
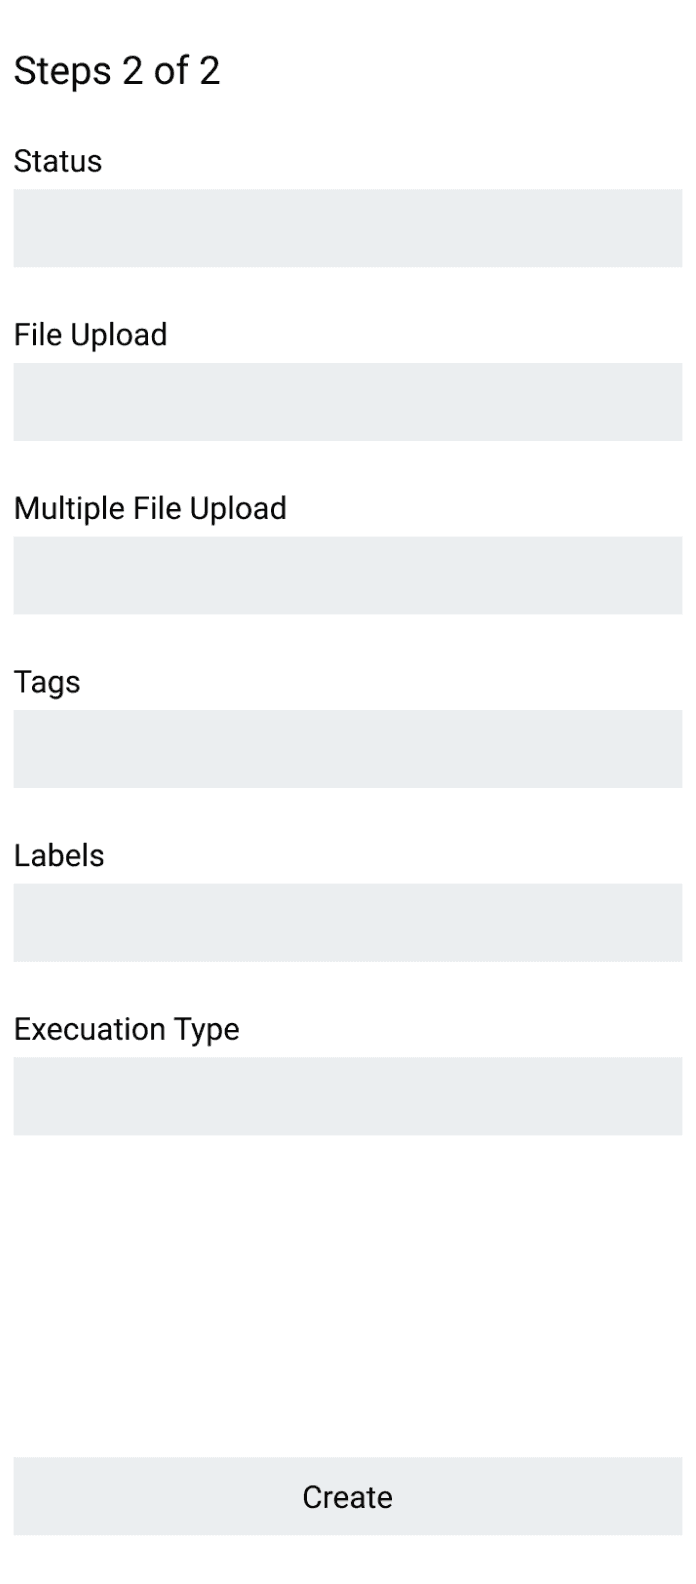
layout with discovered data points distributed in 2 pages
Iteration 2
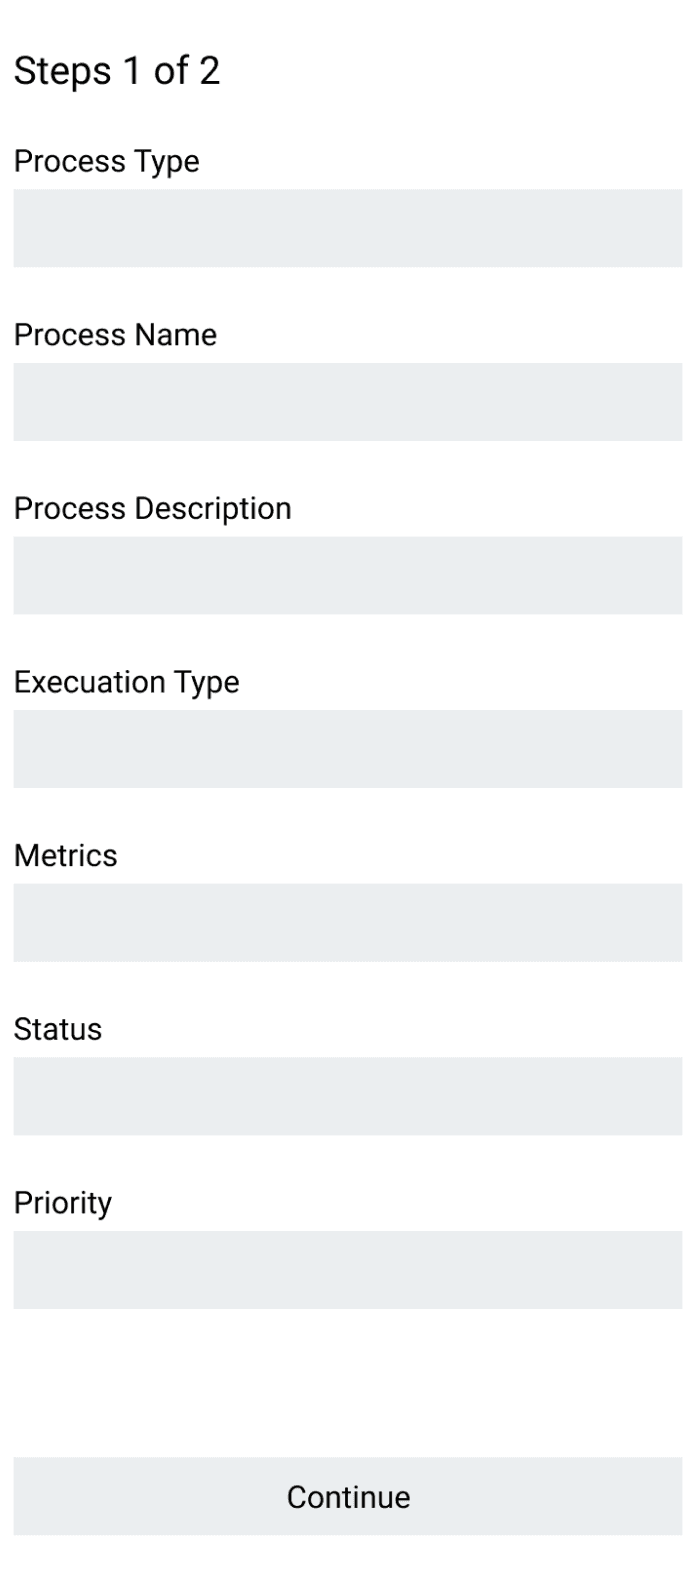
Applied logical order of input fields & similar fields together.
Iteration 3
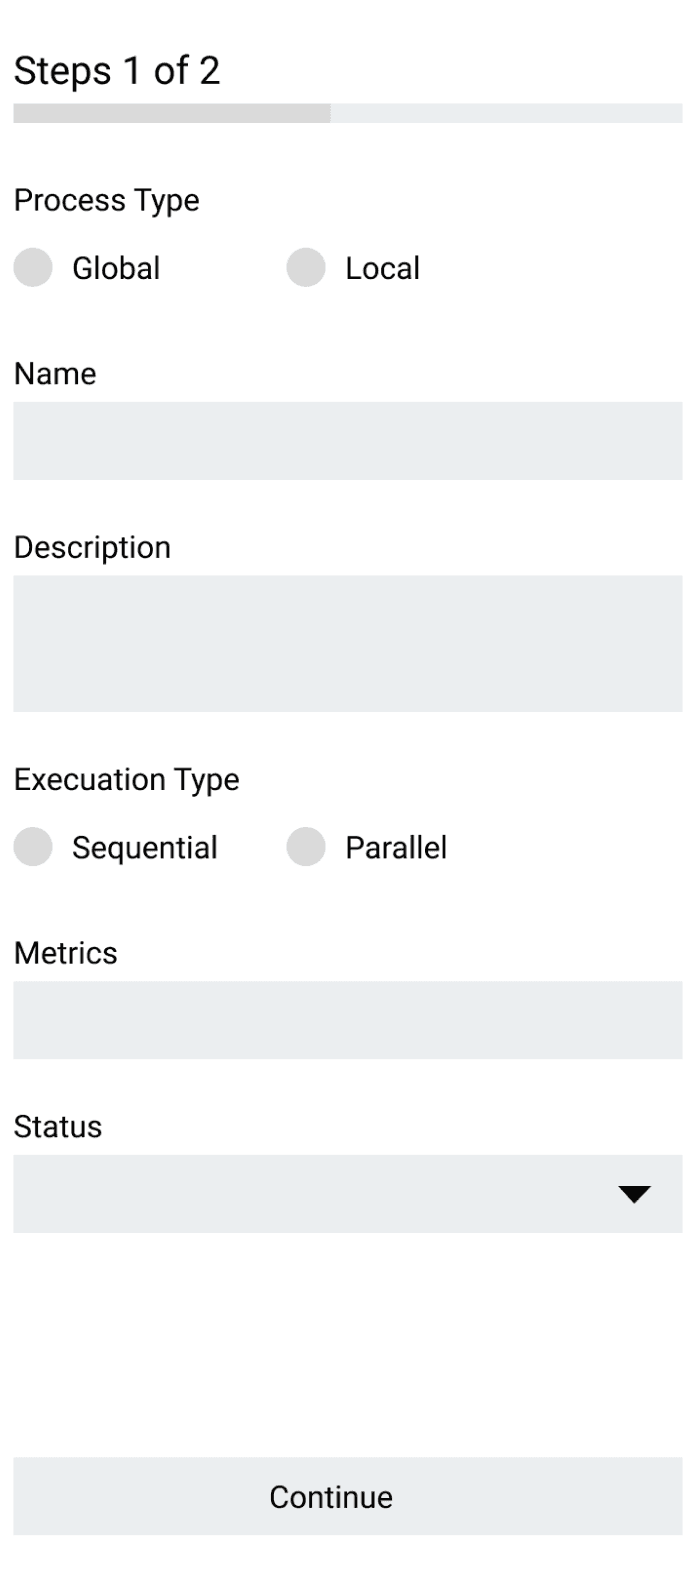
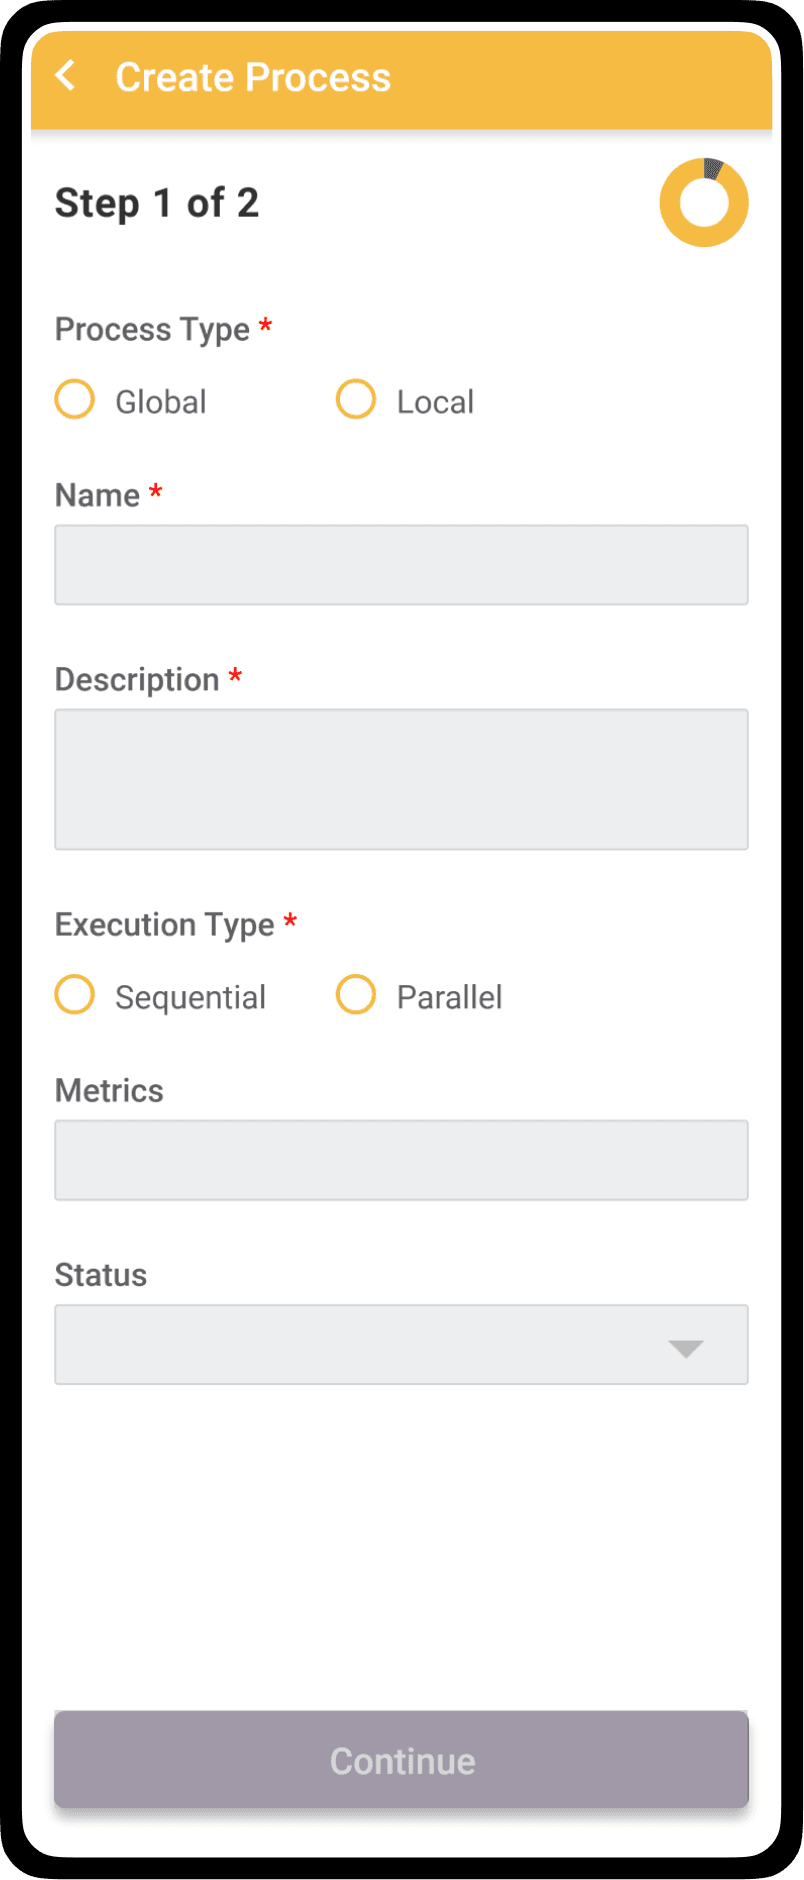
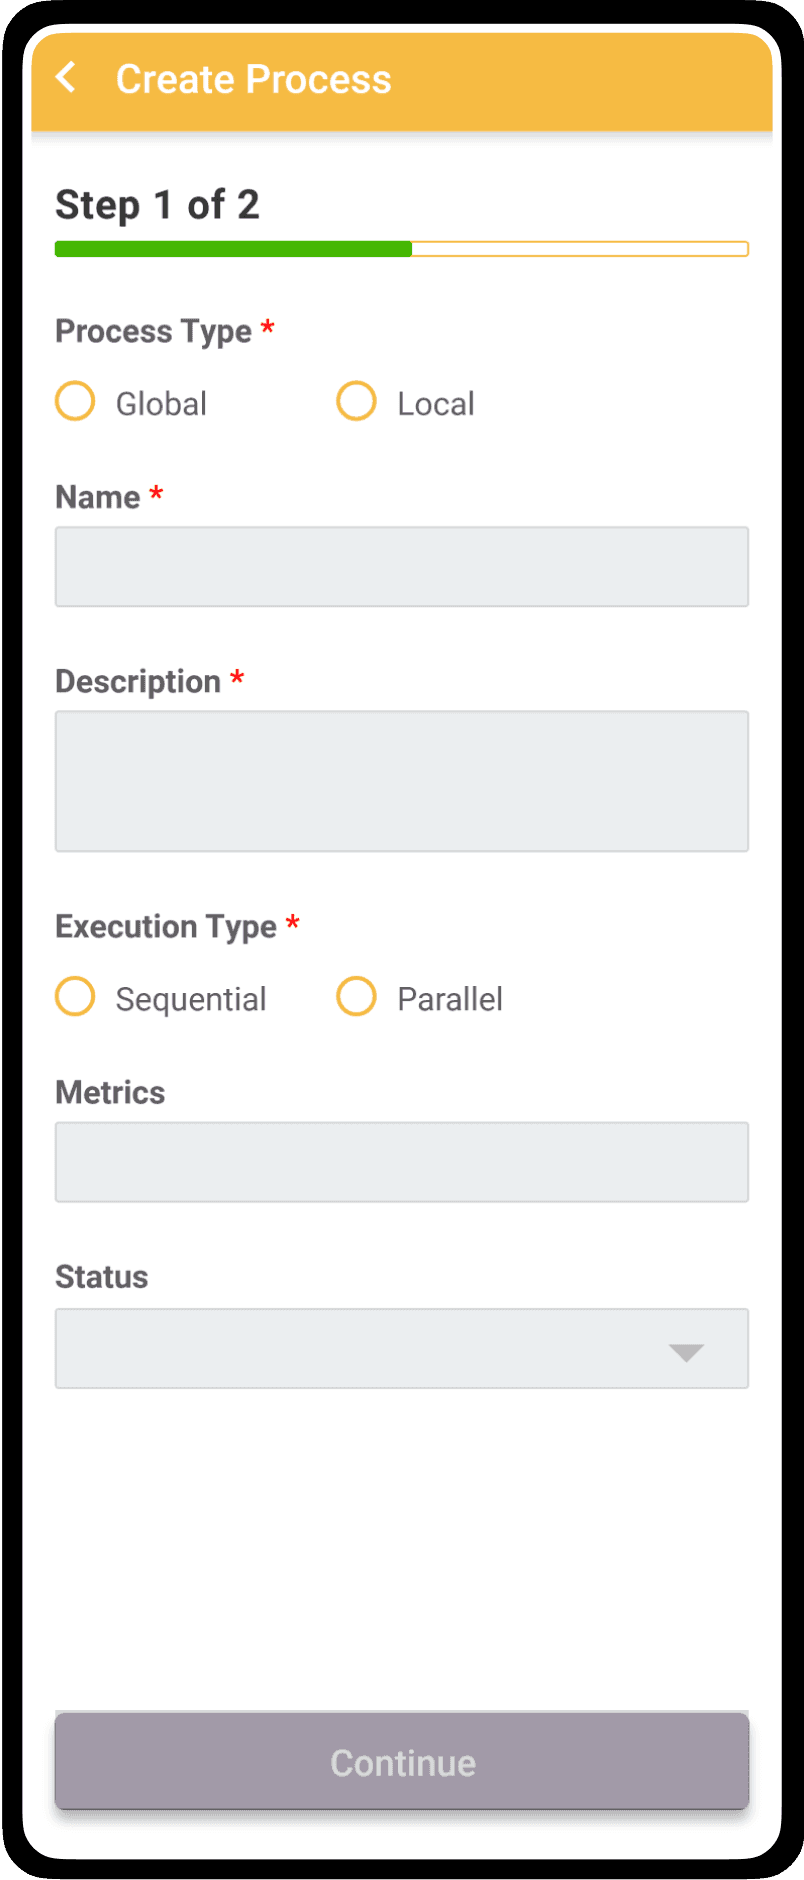
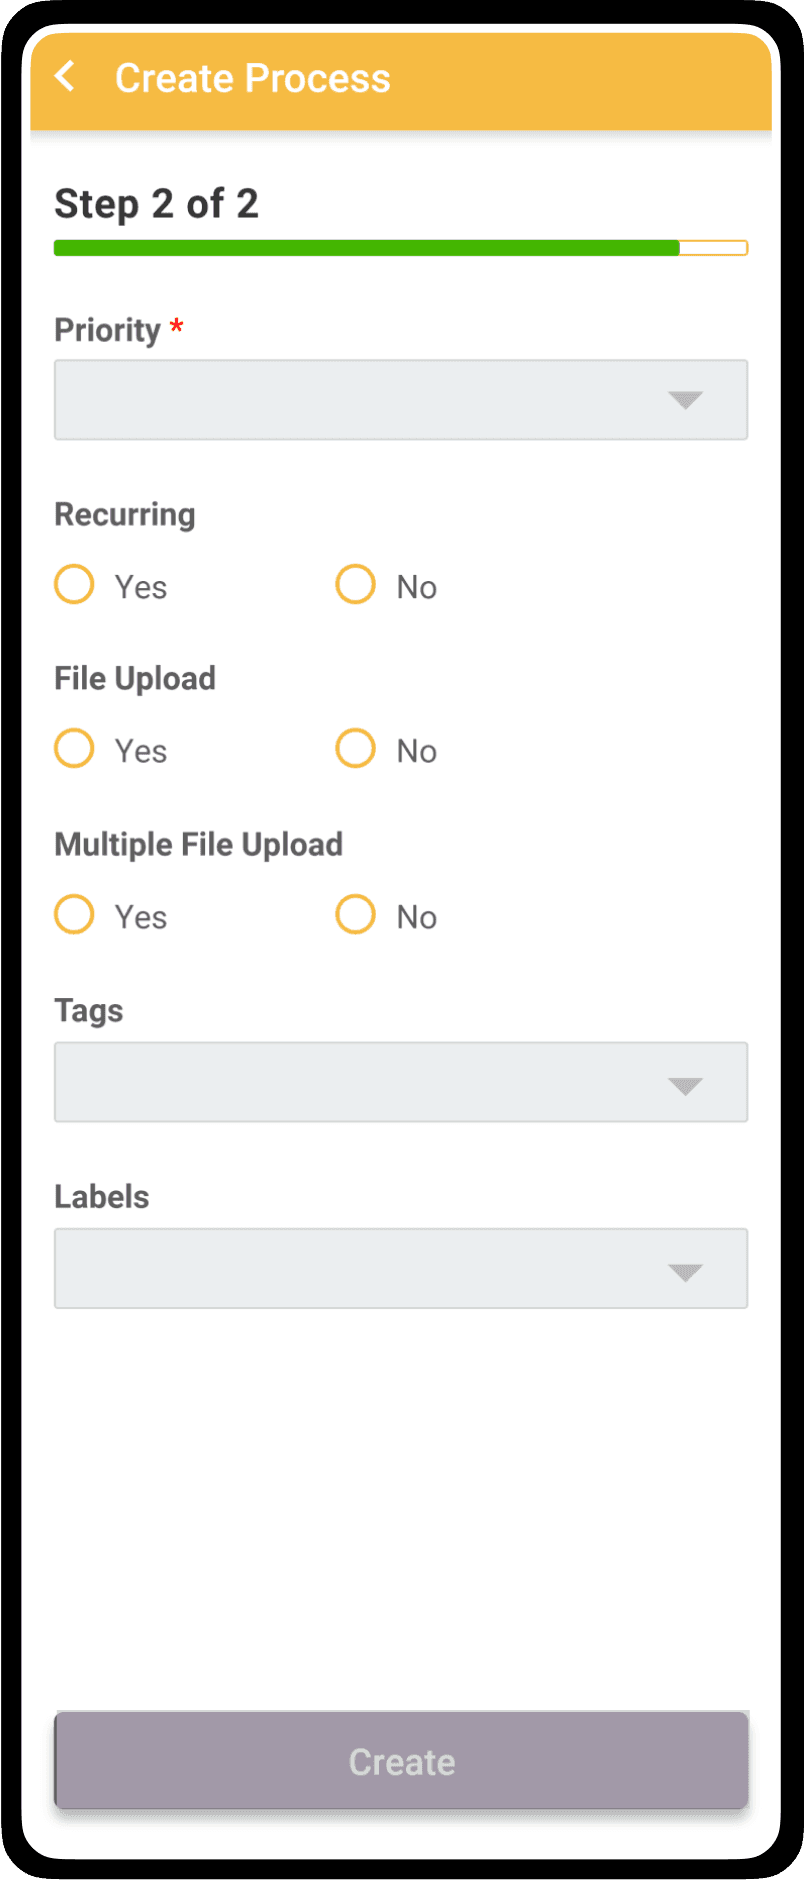
To simplify the process, added interaction like radio buttons, dropdown & progress bar
Based on the iteration 3, mid fidelity designs with different visual styles
Iteration 1
Iteration 2
Iteration 3
Create Process V2
Process Detail: 1
Sub Process
Version 2
Wireframes iterations with data points
Process Listing V1
Process View V1
Process Listing V2
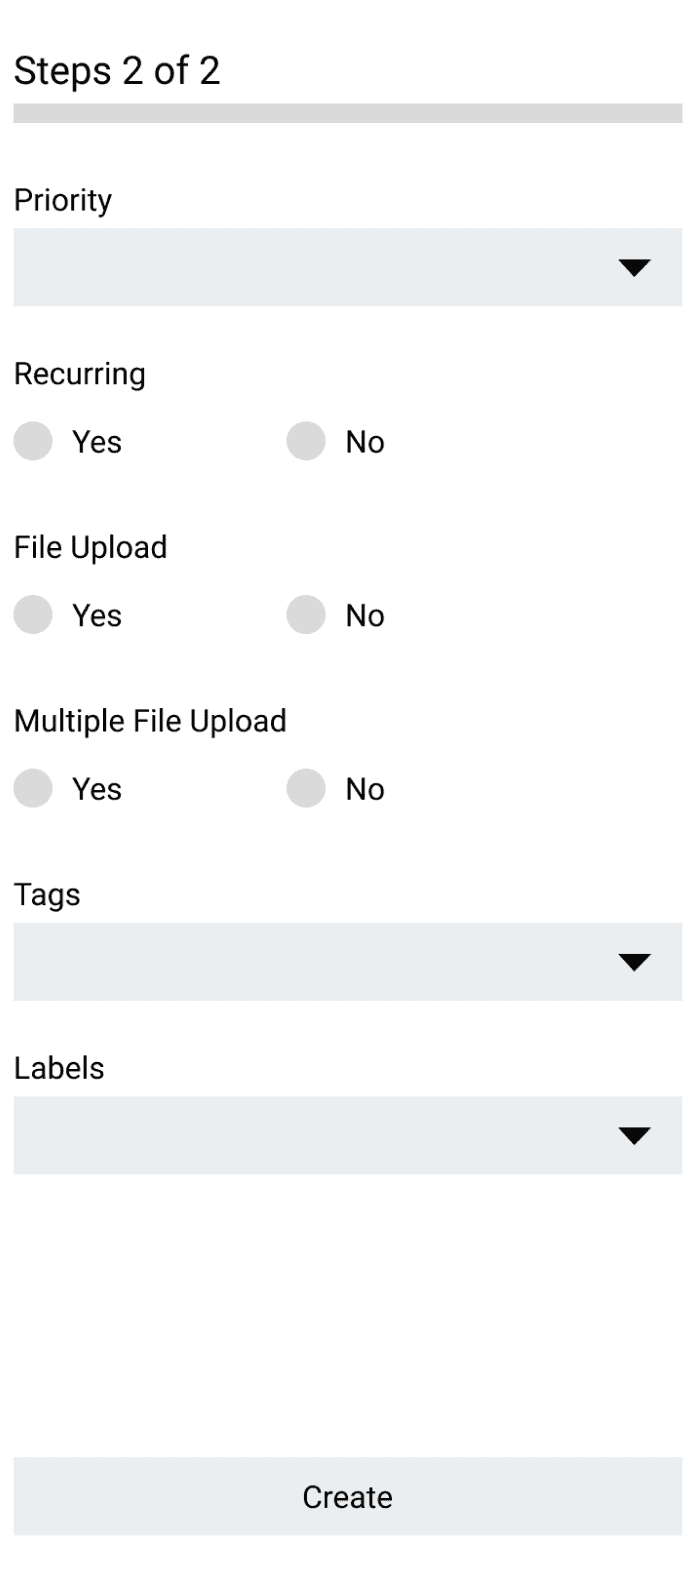
Create Process Form
Process View V2
With multiple design itearations & finalizing the user flow, created the High fidelity design.
High Fidelity Designs
Listing the UI Elements of pages along with their Data points & usage.
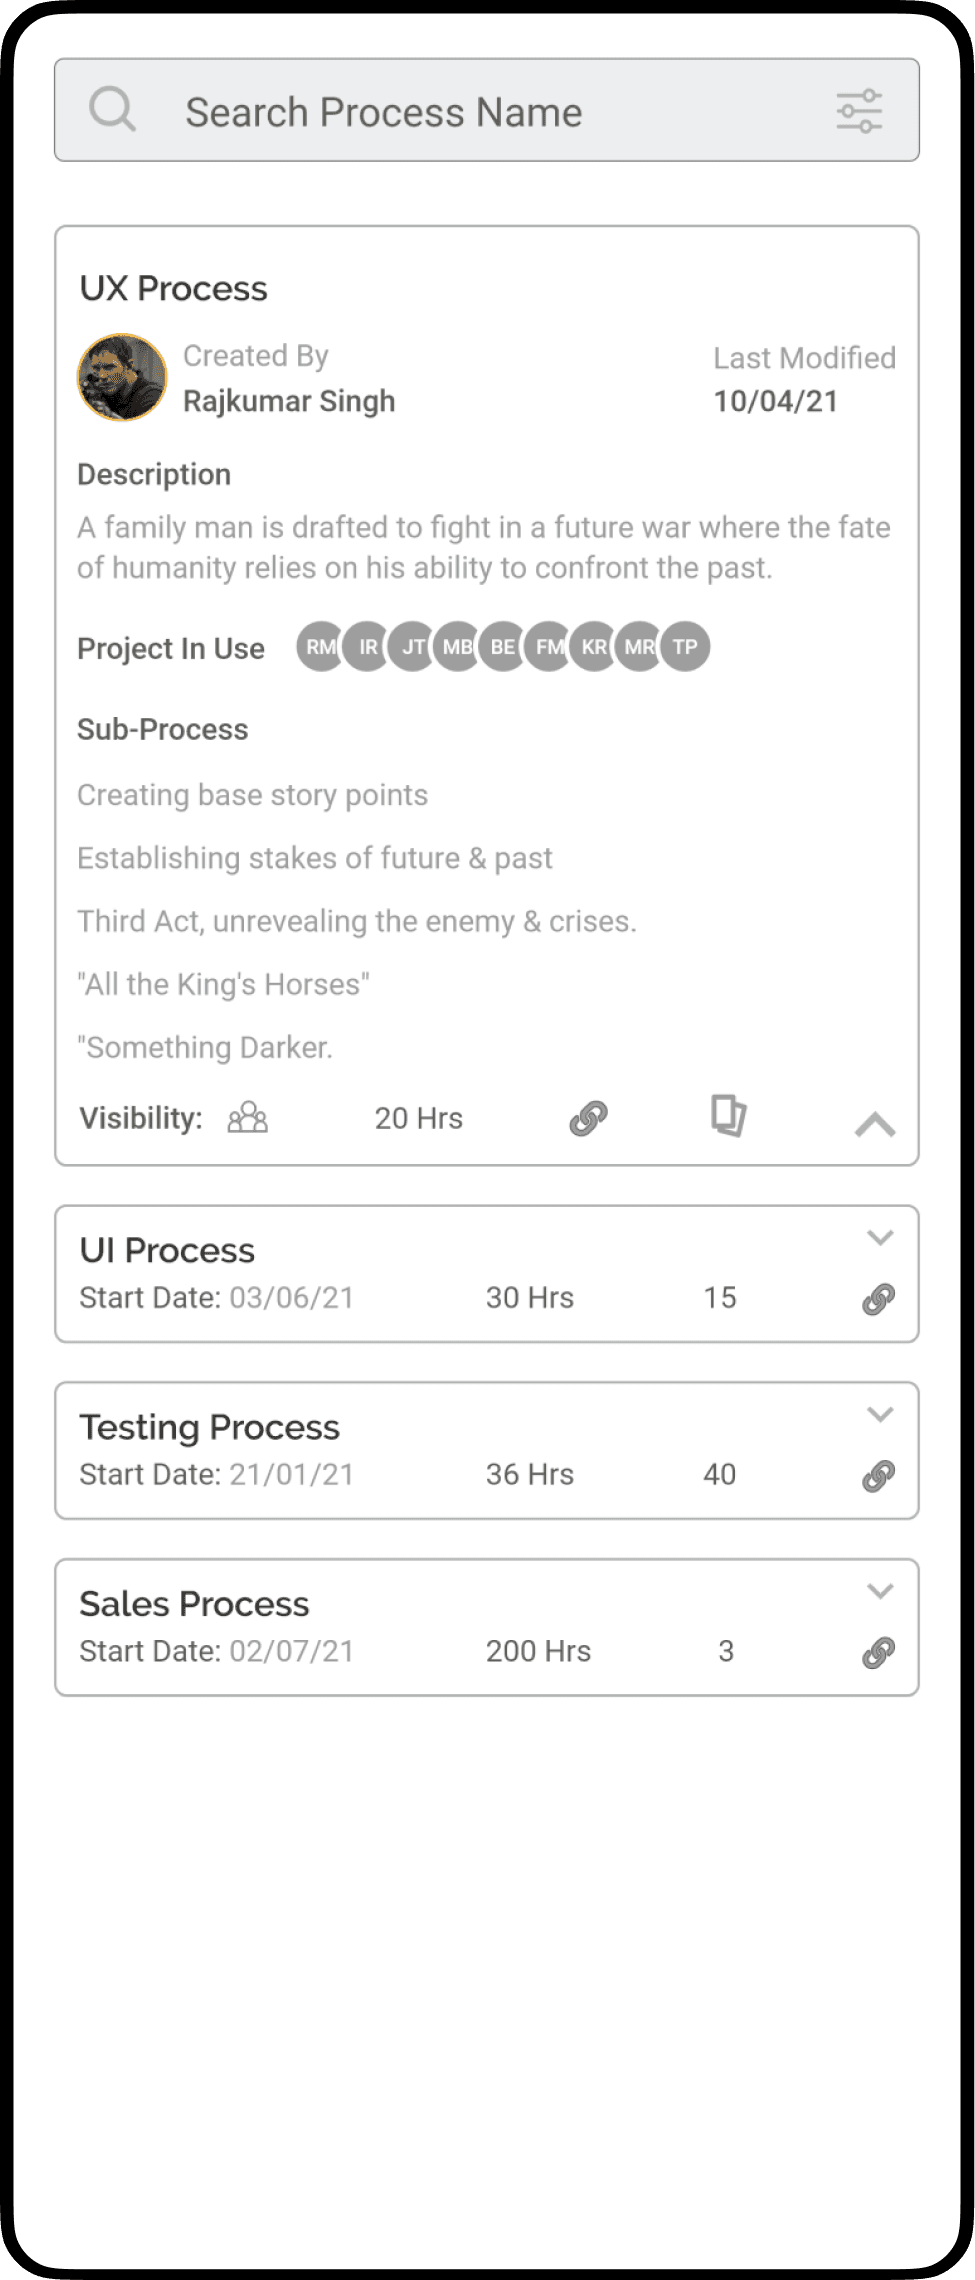
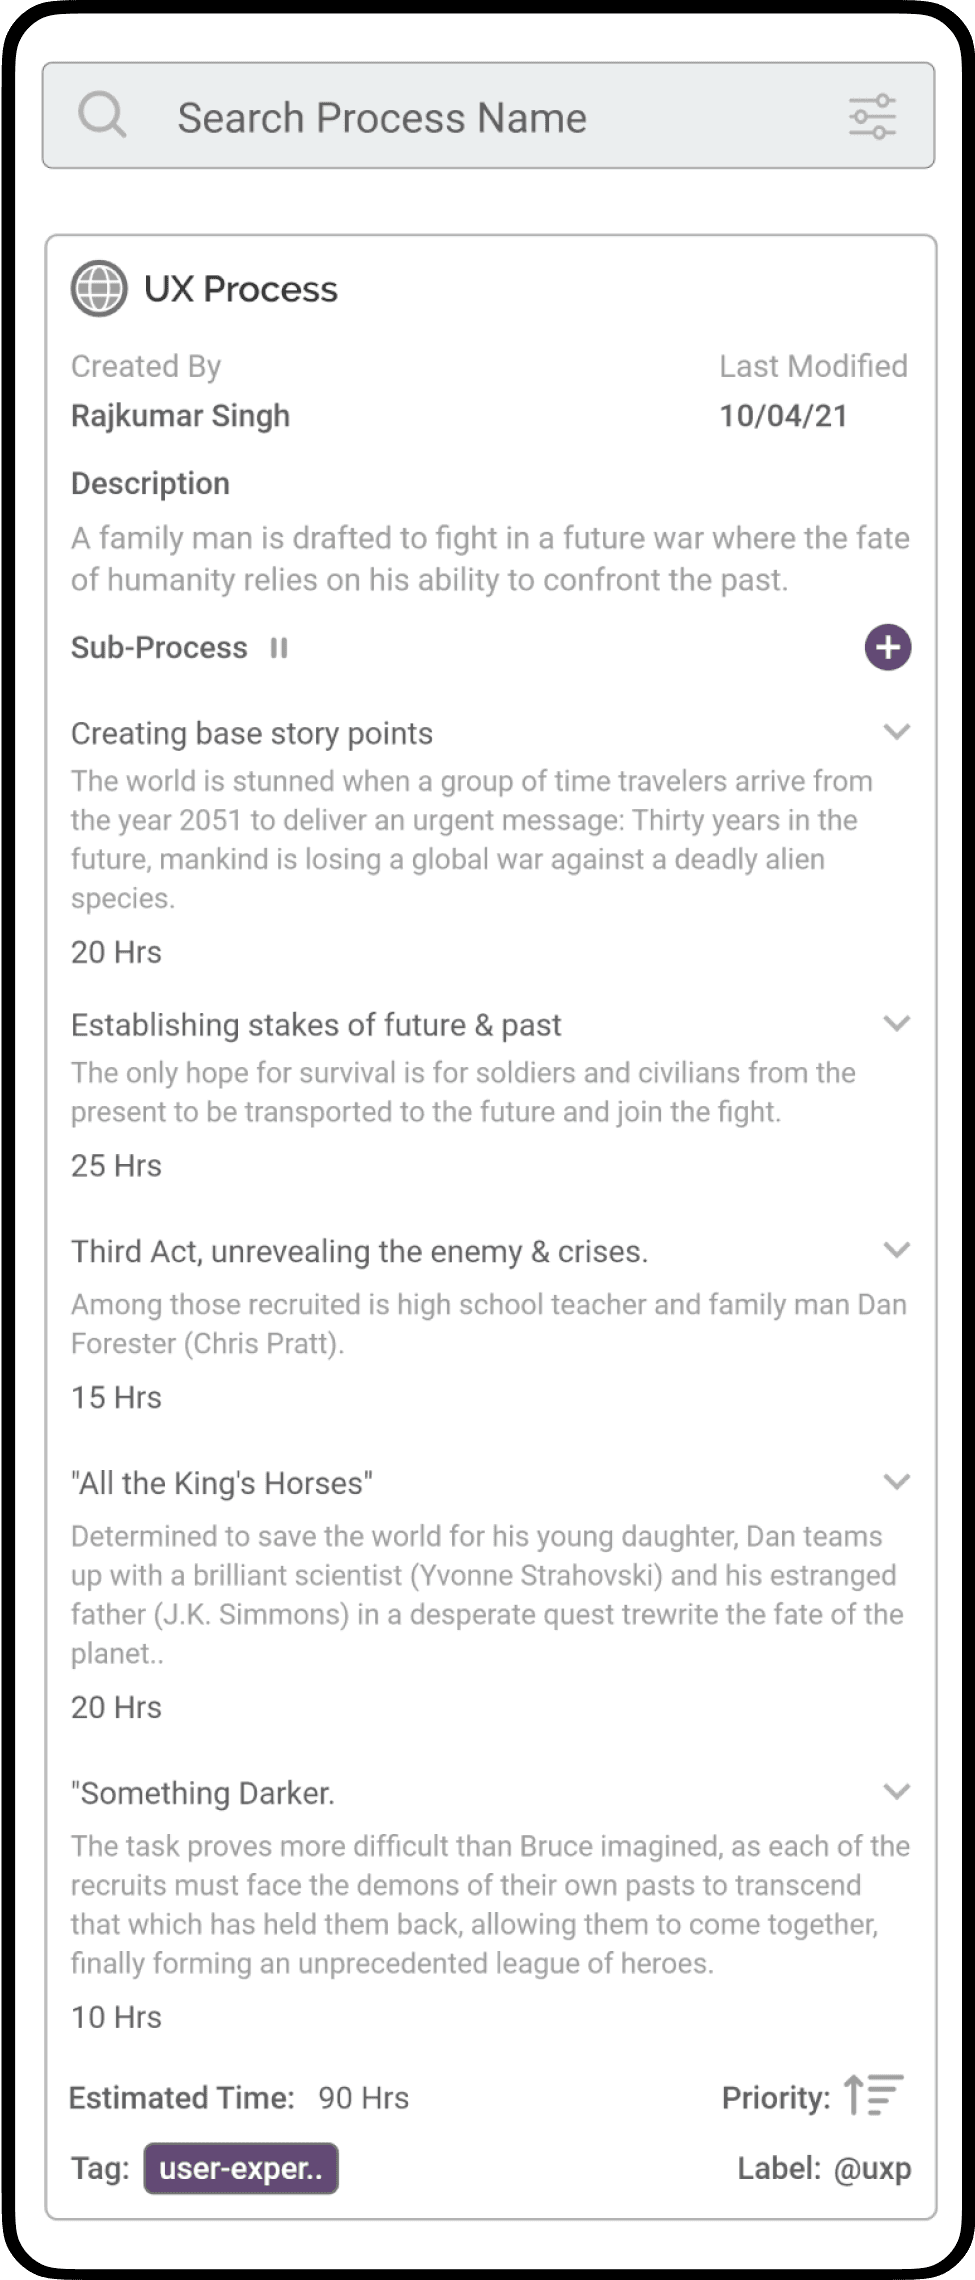
Process List
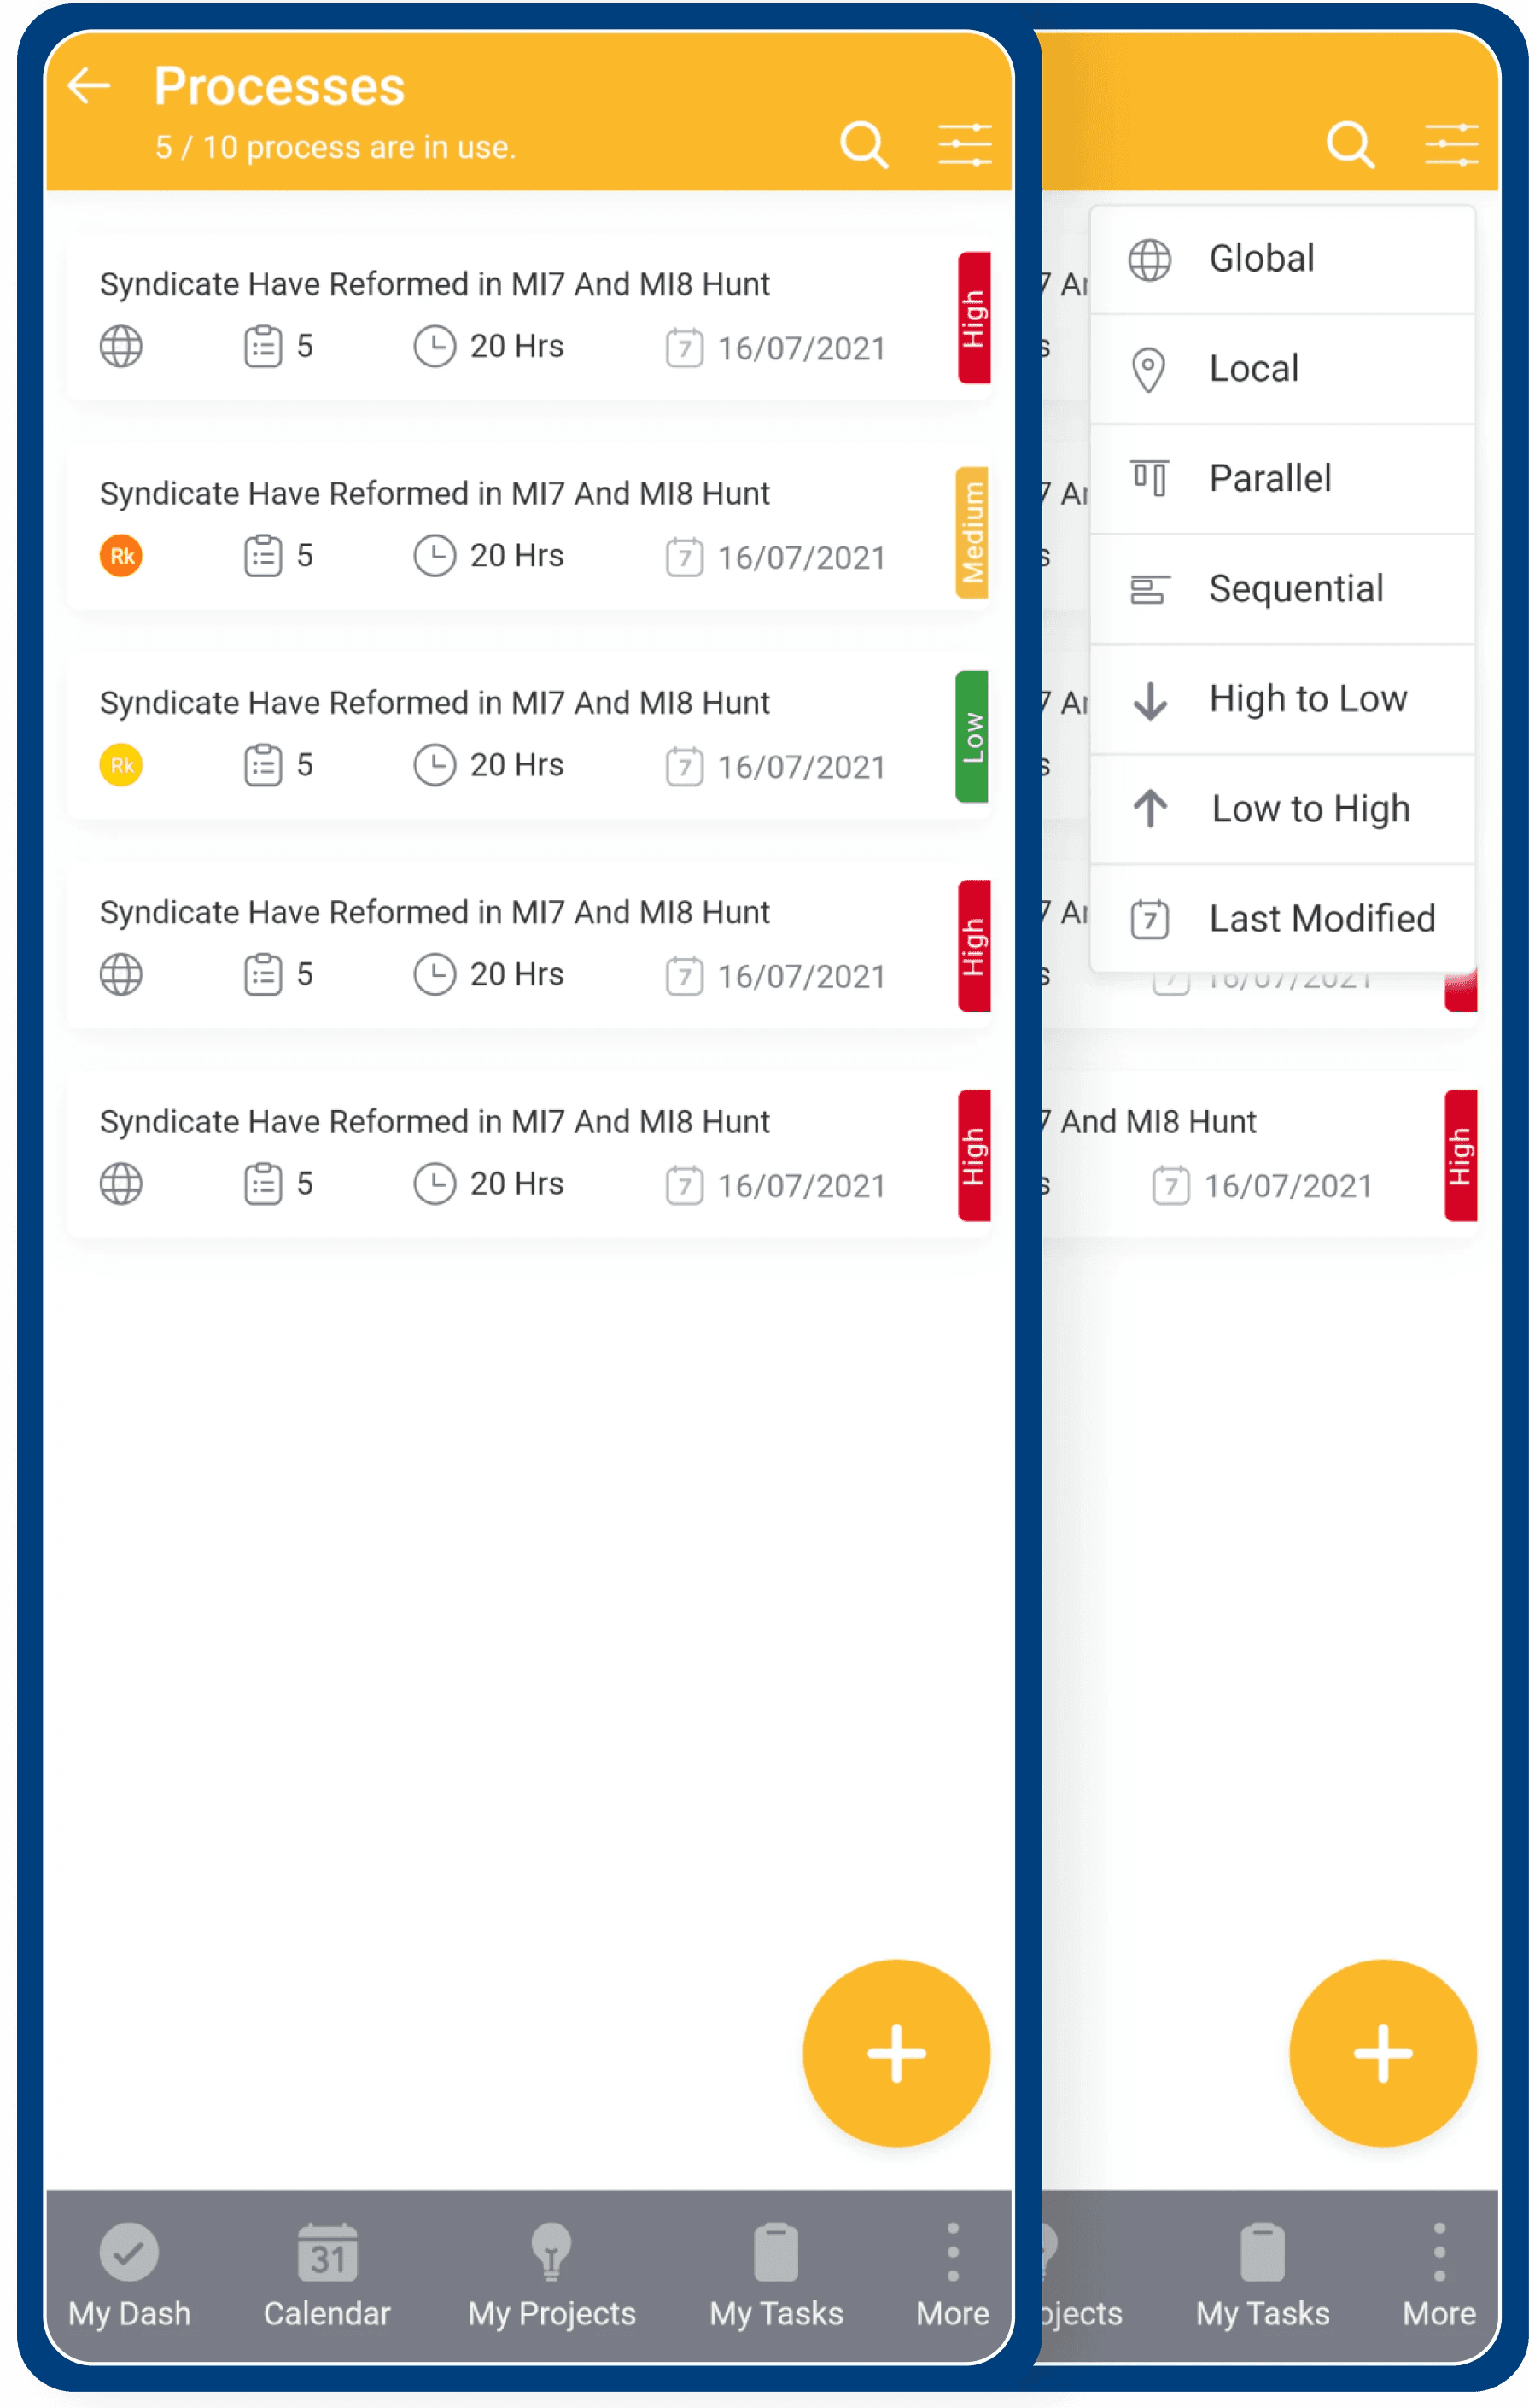
Compilation of both global and local project processes, arranged based on their most recent modification date by default, including information like estimated time, priority level, and the count of sub processes.
Top Navigation Bar: Fixed position on every process page
Label
Process Name
Number of process in use
out of the total process.
Action Items
Back to previous page
Search Bar
Filter
Process Card: List order by filter: priority, date modified etc.
Magnitude
Sub process
Estimated time
Last Date Modified
Category
Global
Local
Label
Process Name
High Fidelity Designs
Listing the UI Elements of pages along with their Data points & usage.
Process List
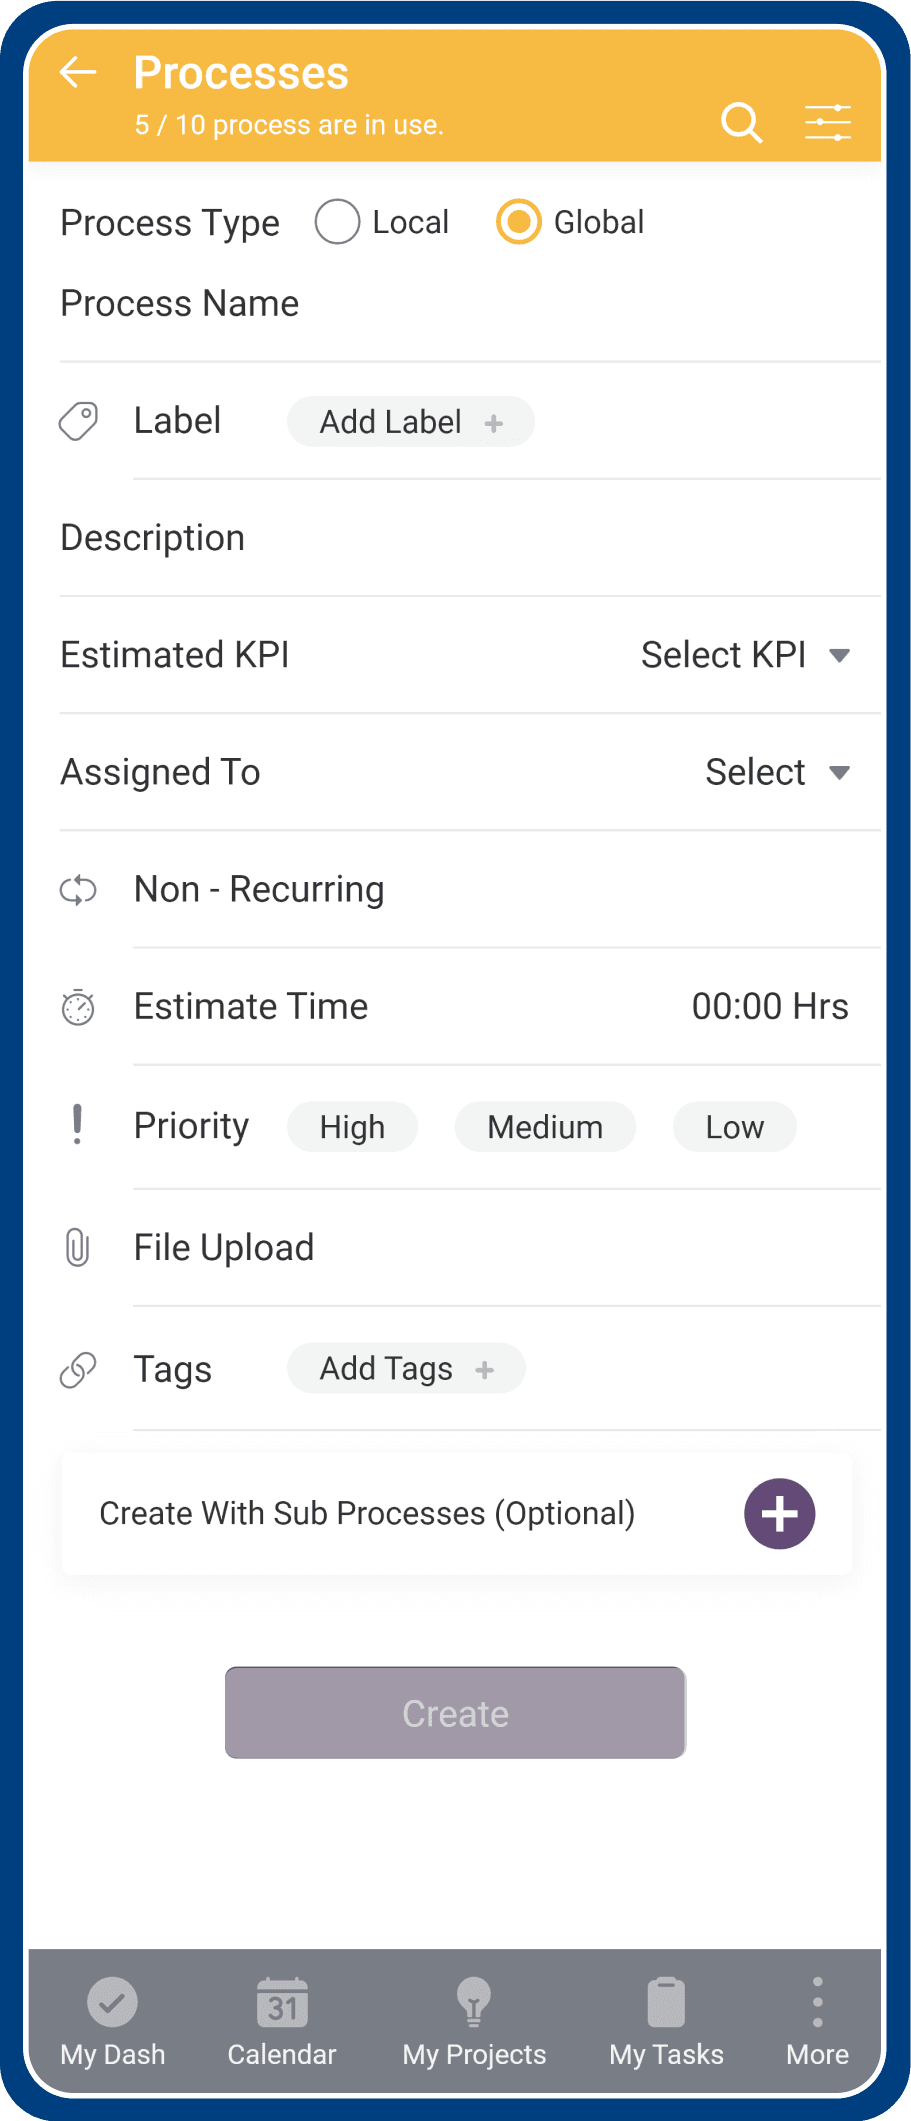
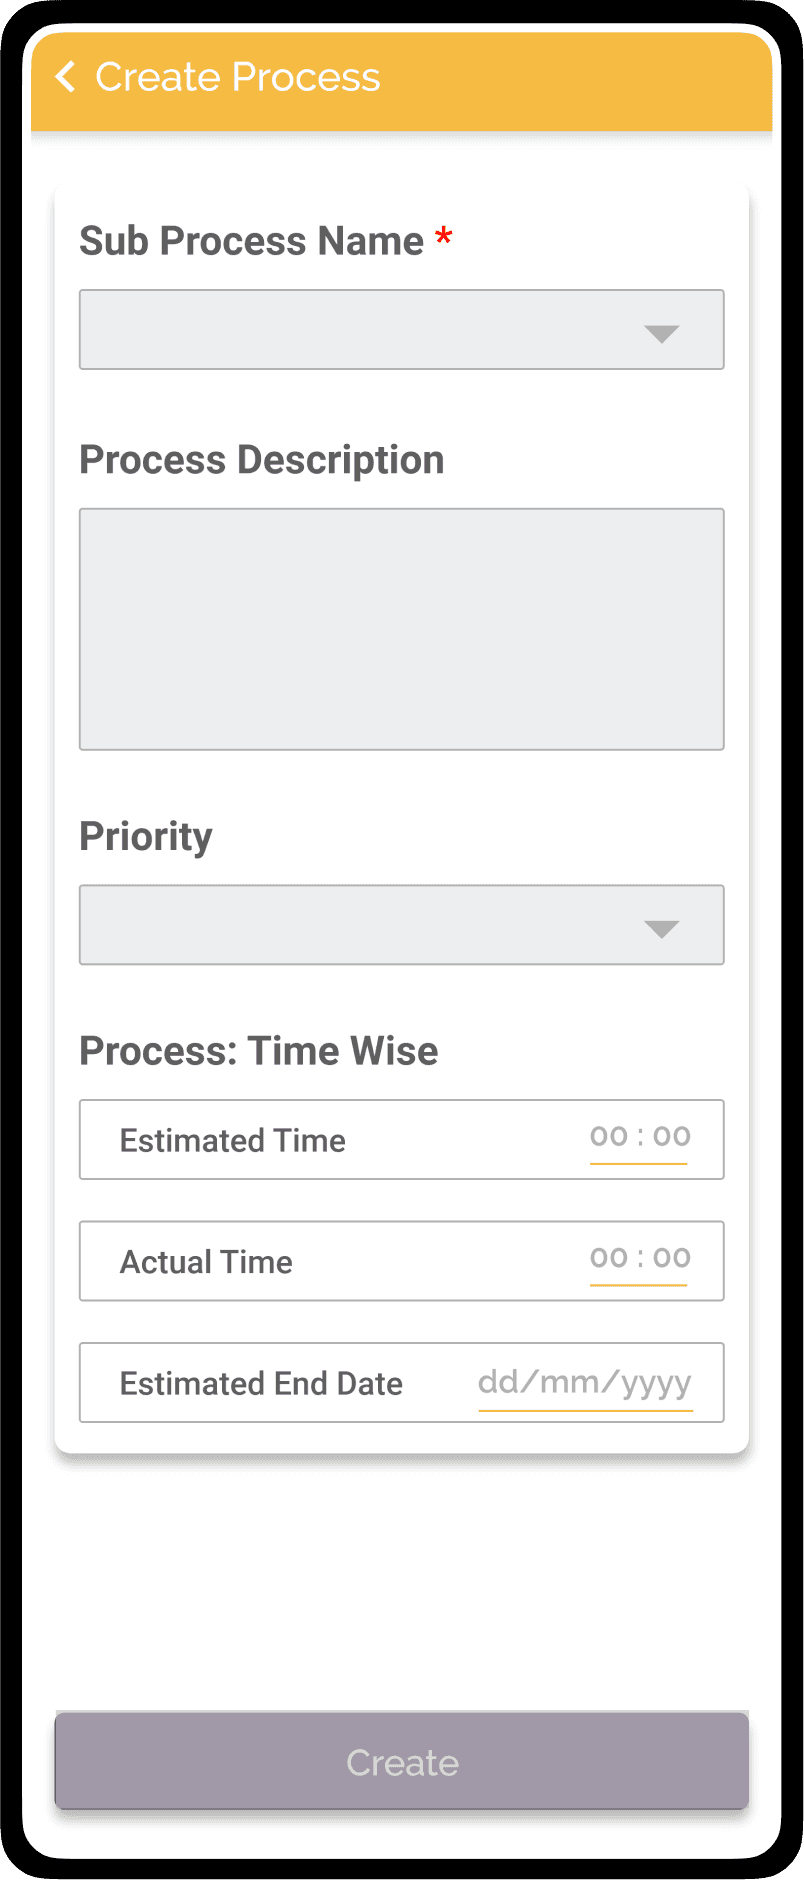
Field Form
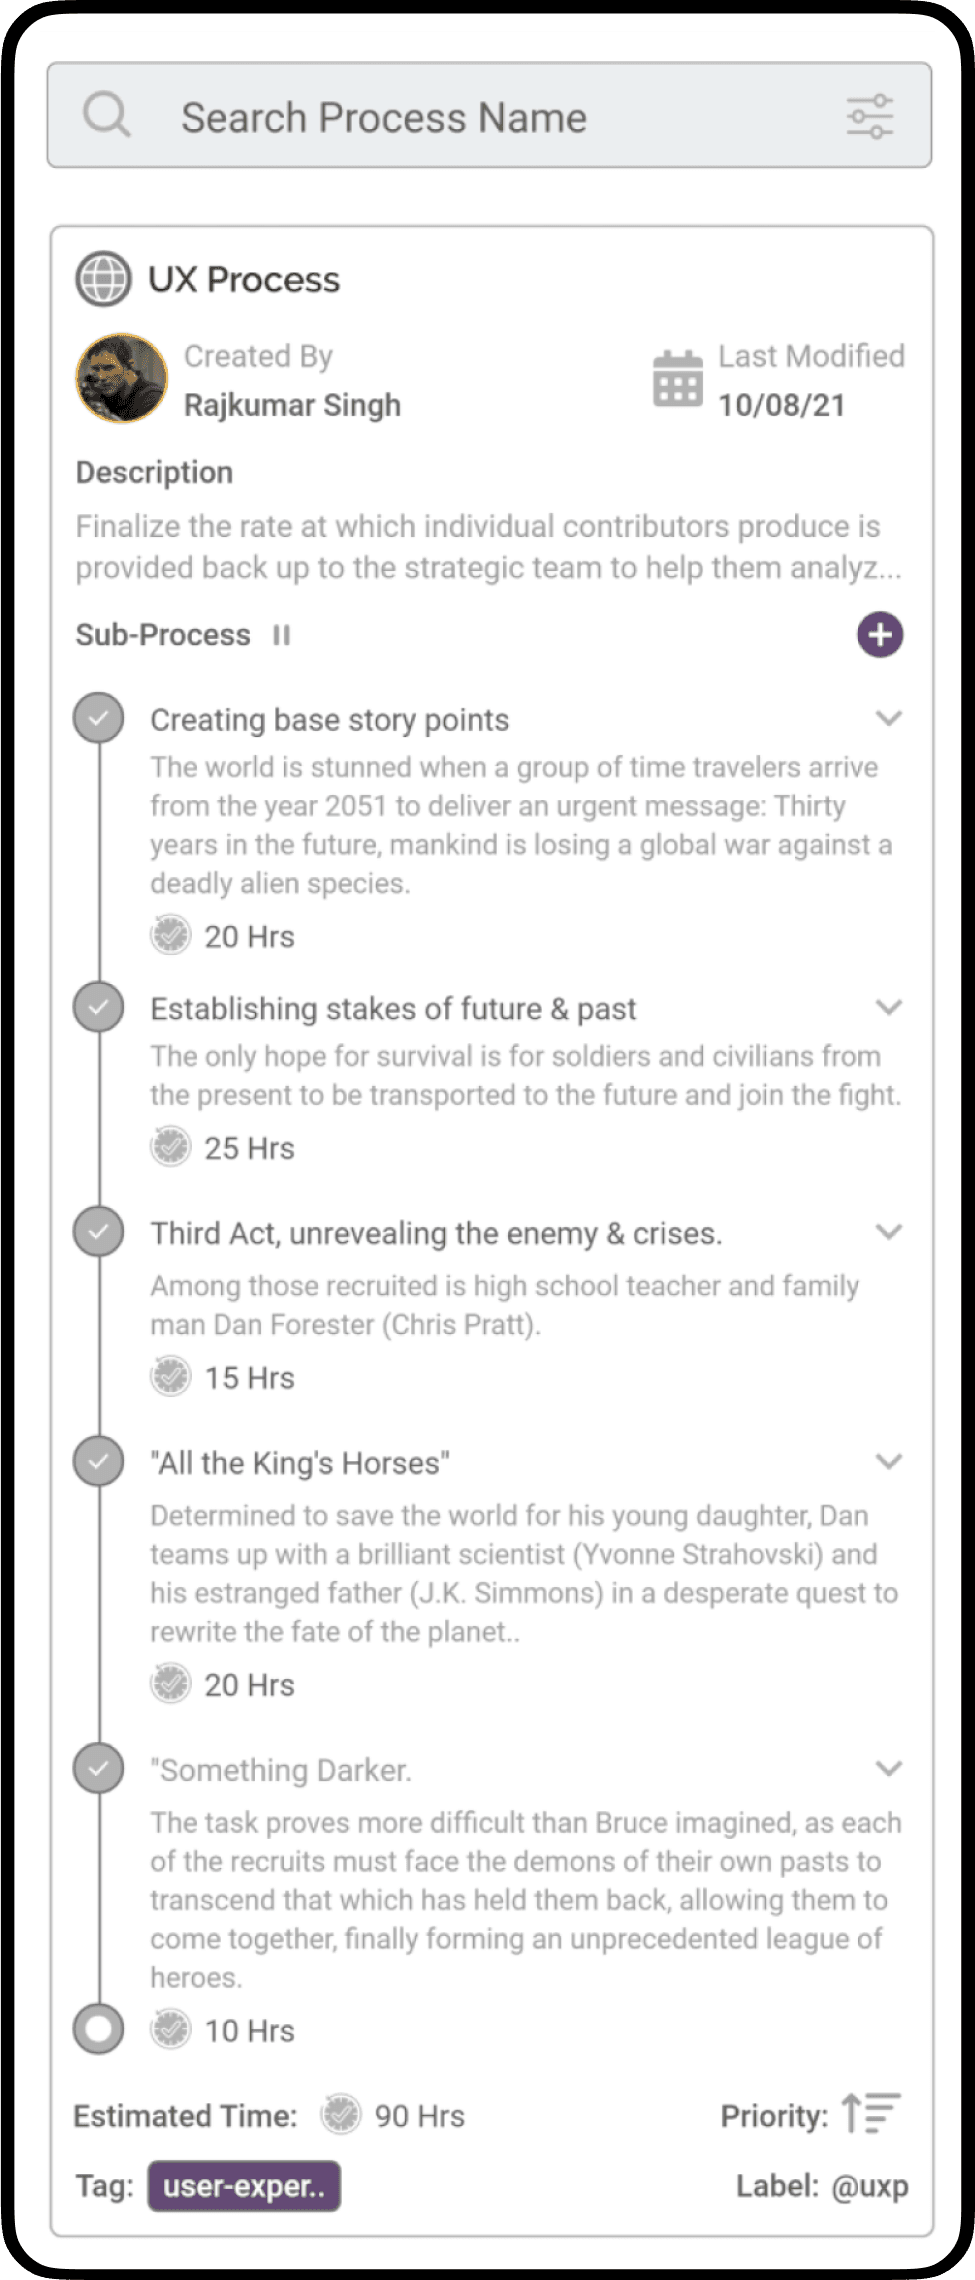
Sub Process
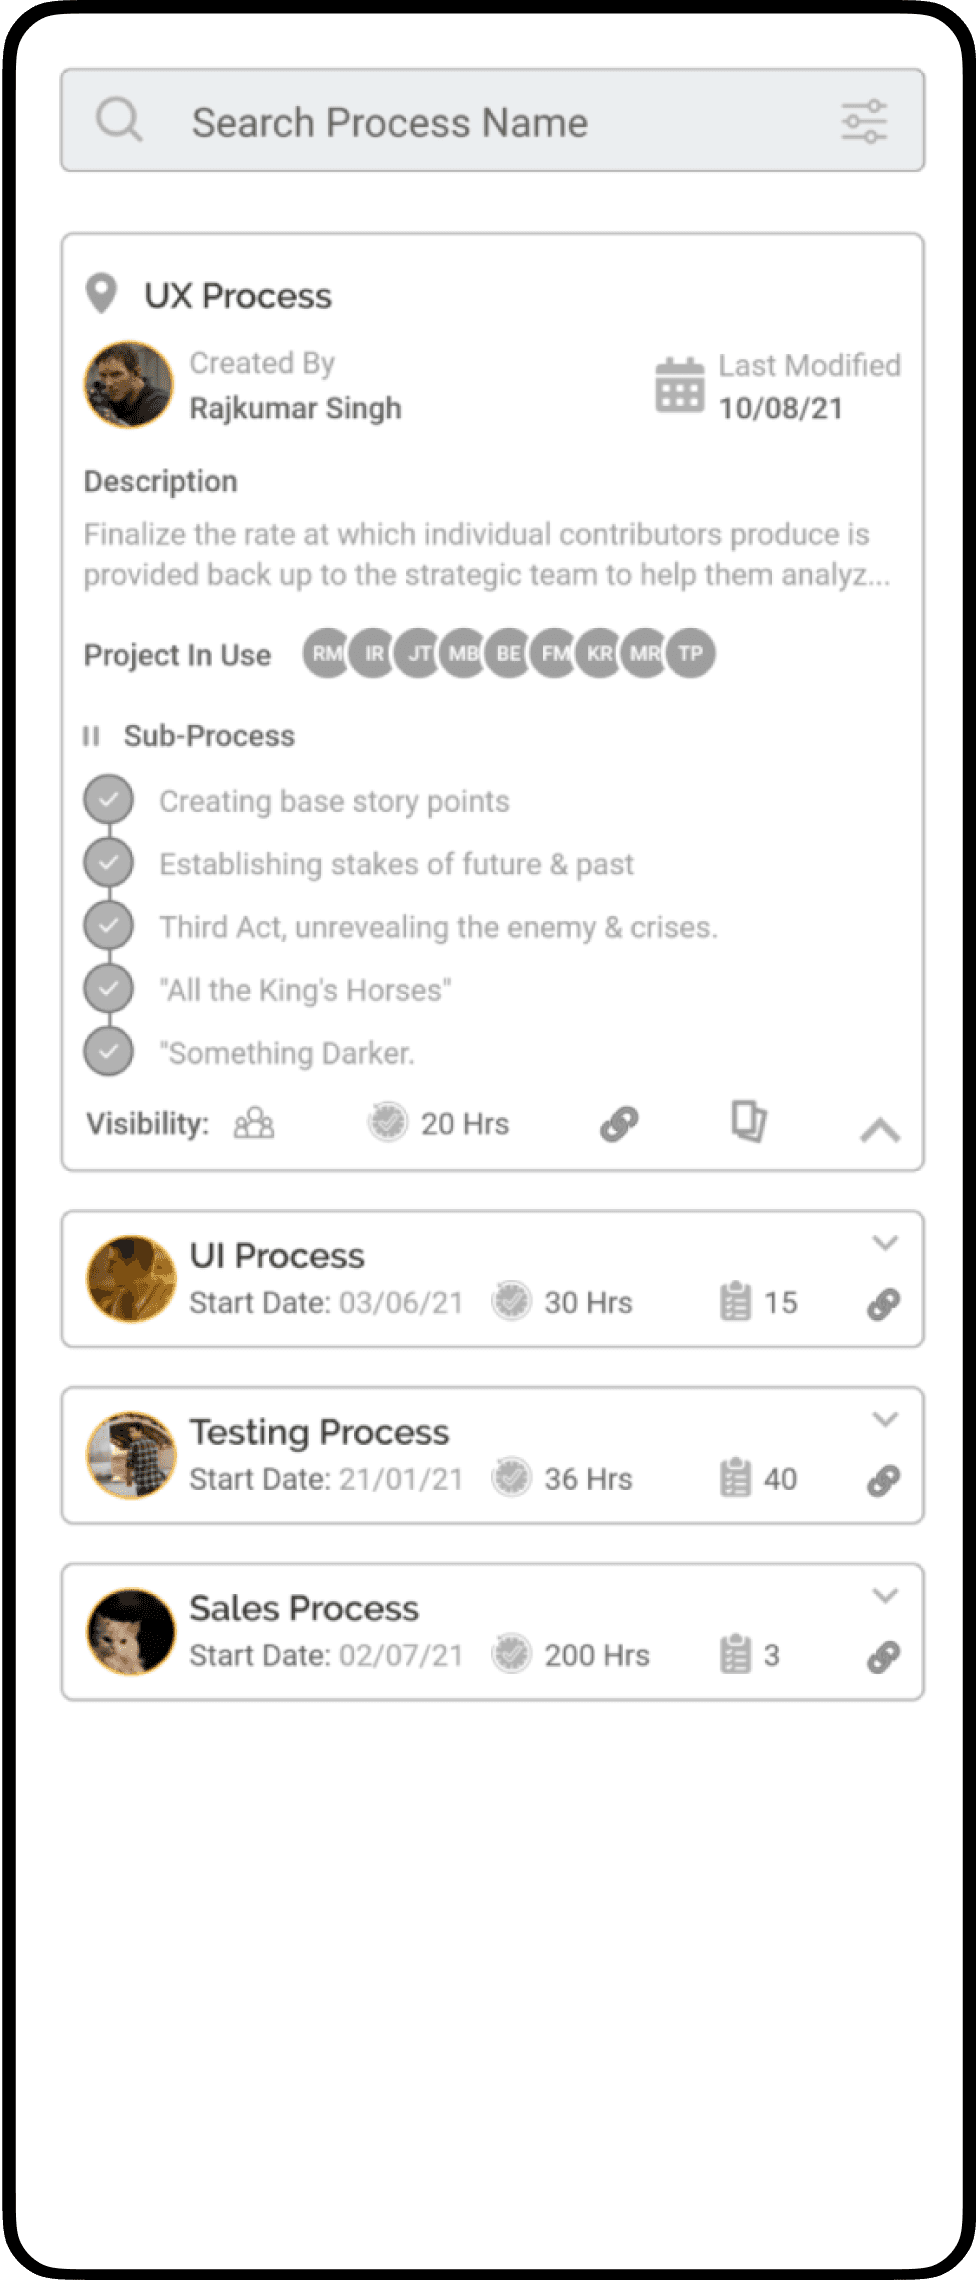
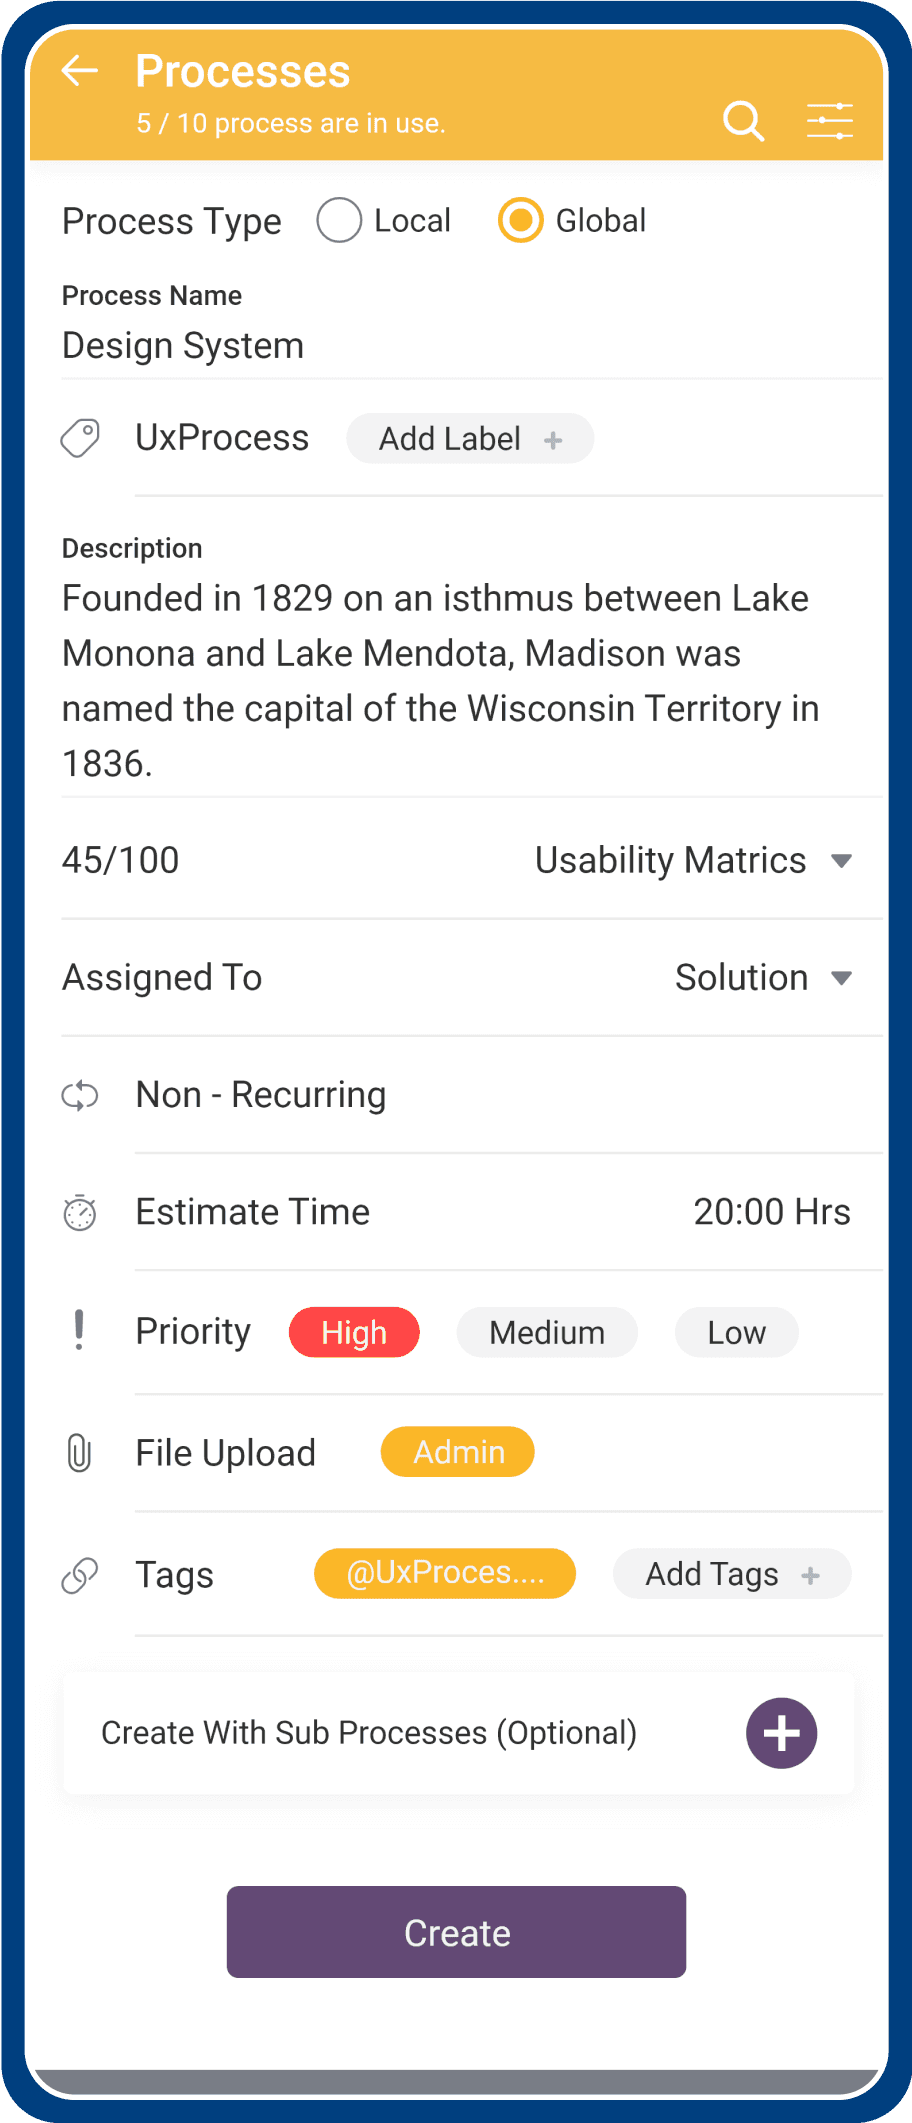
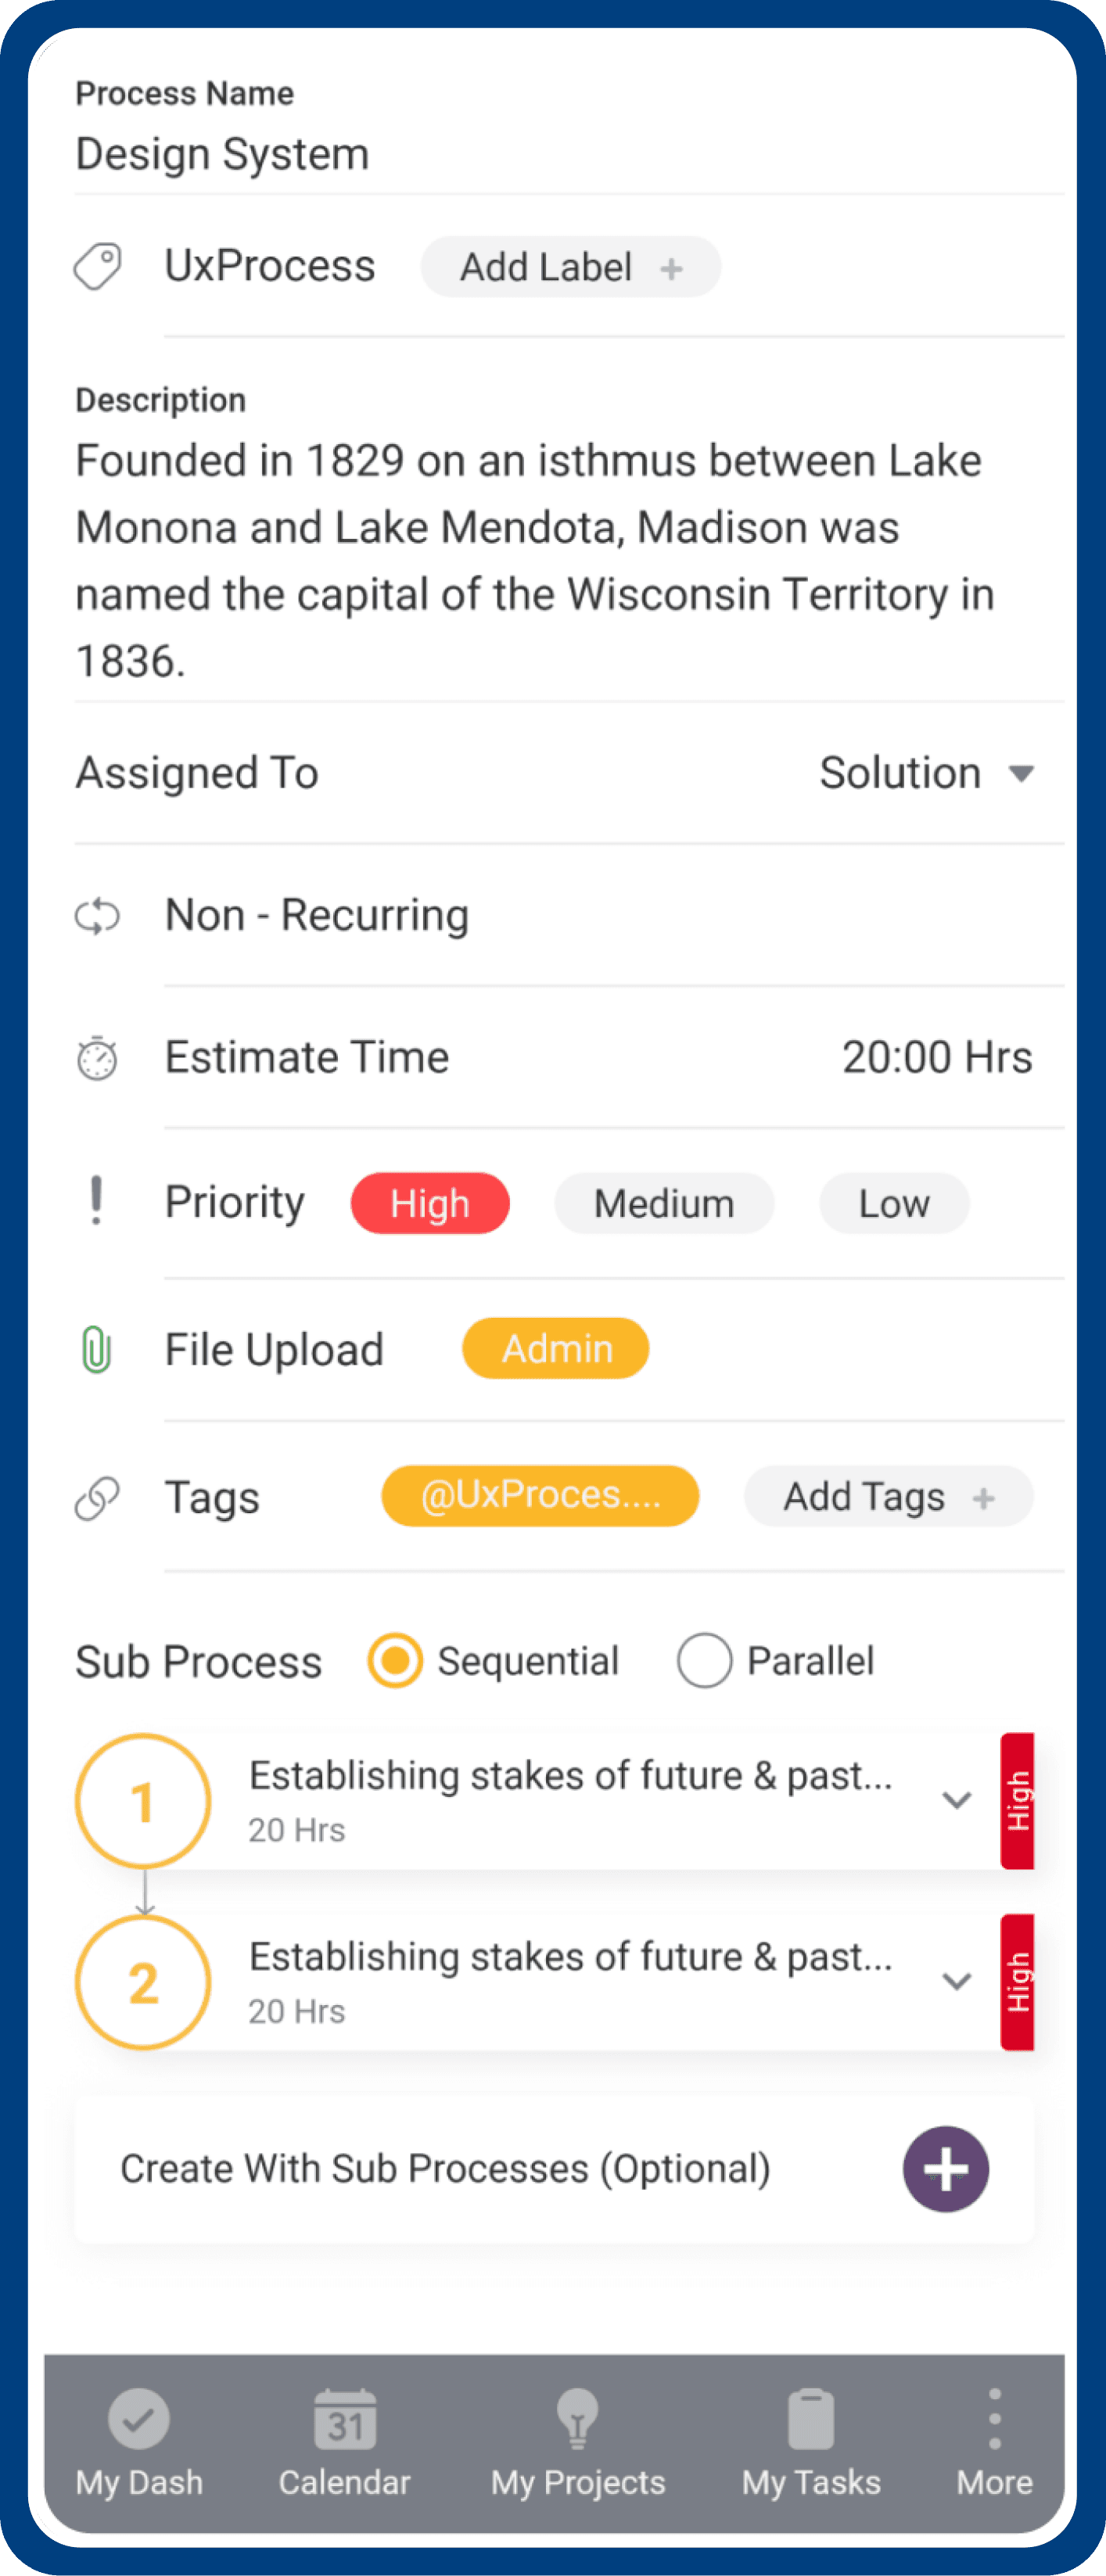
Overview
Offering a comprehensive preview along with the roadmap particulars, including estimated timelines and metrics.
Option
Providing a pre-filled form with the choice to create a standalone process or one with sub processes.
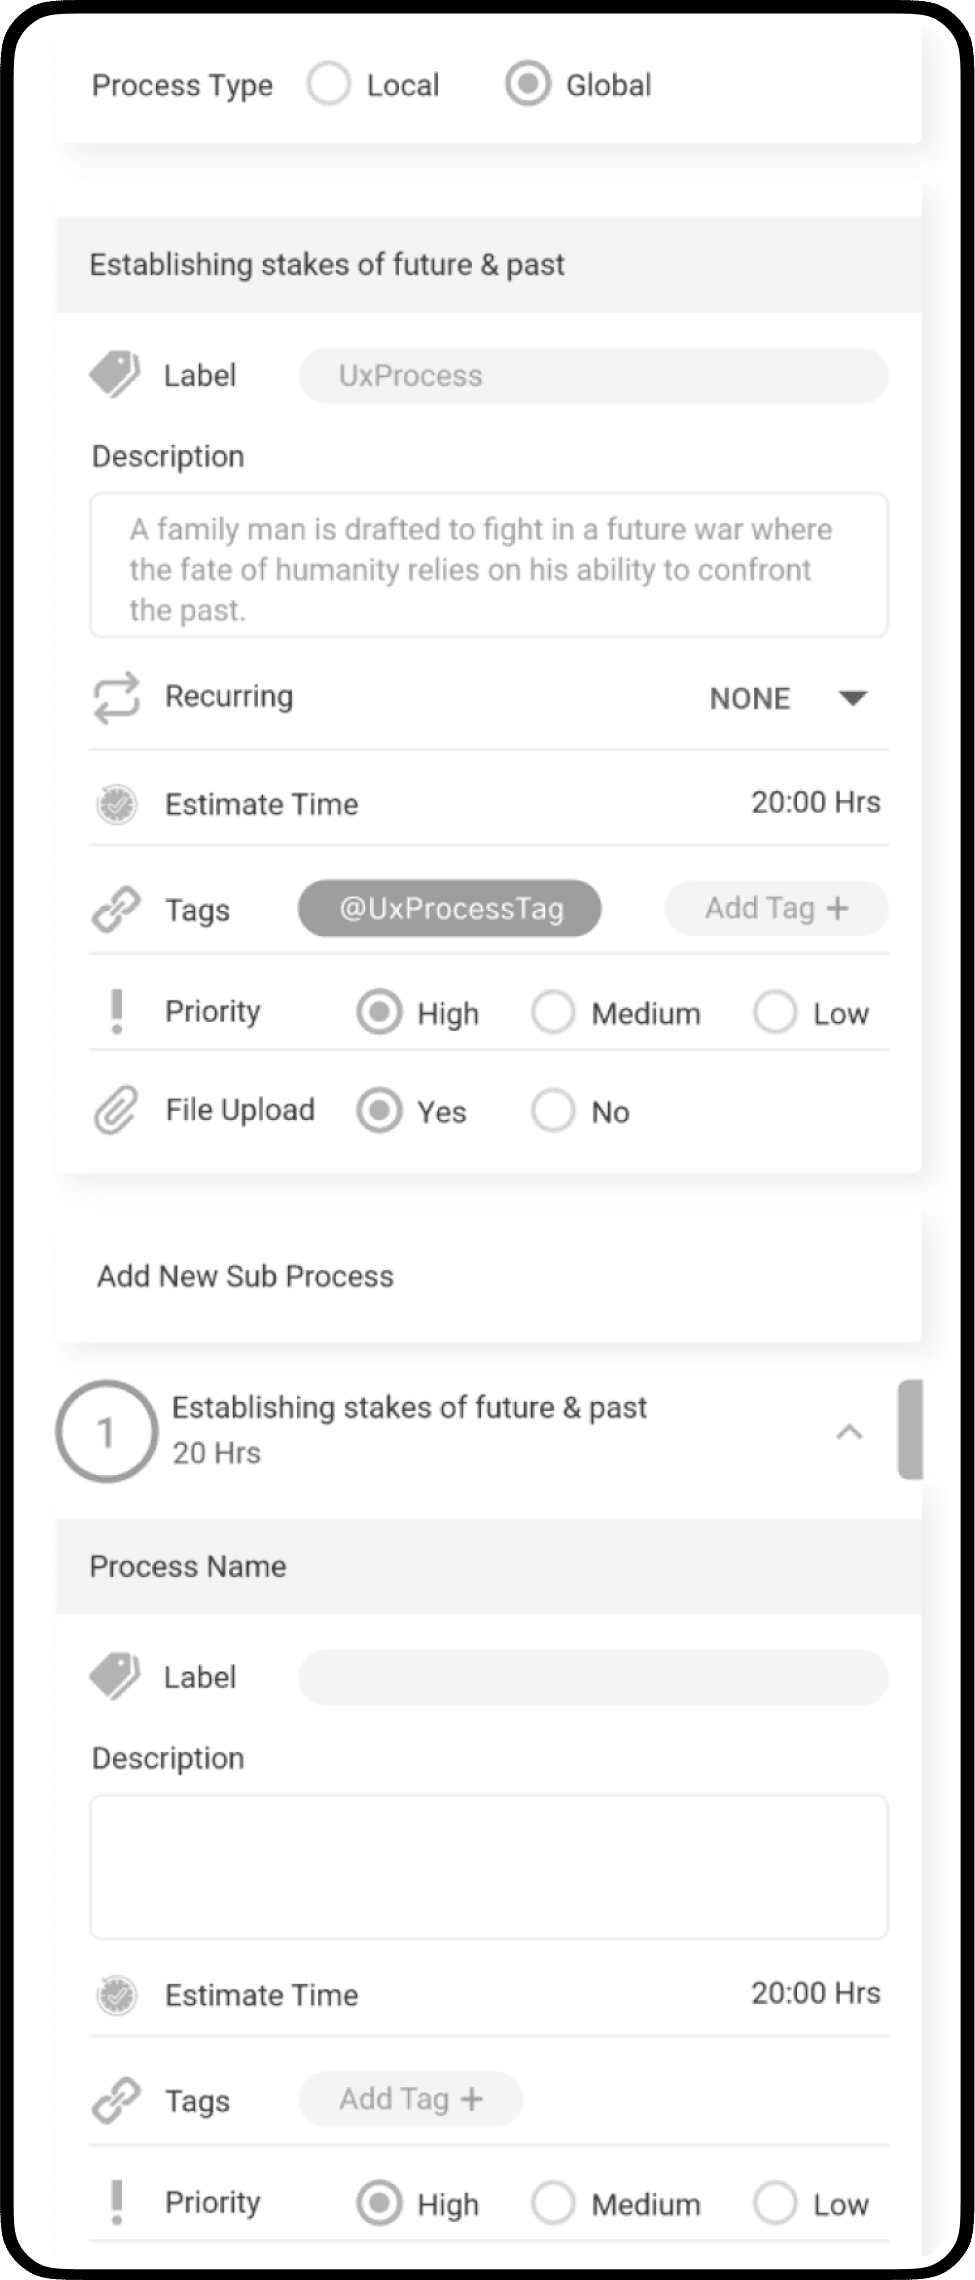
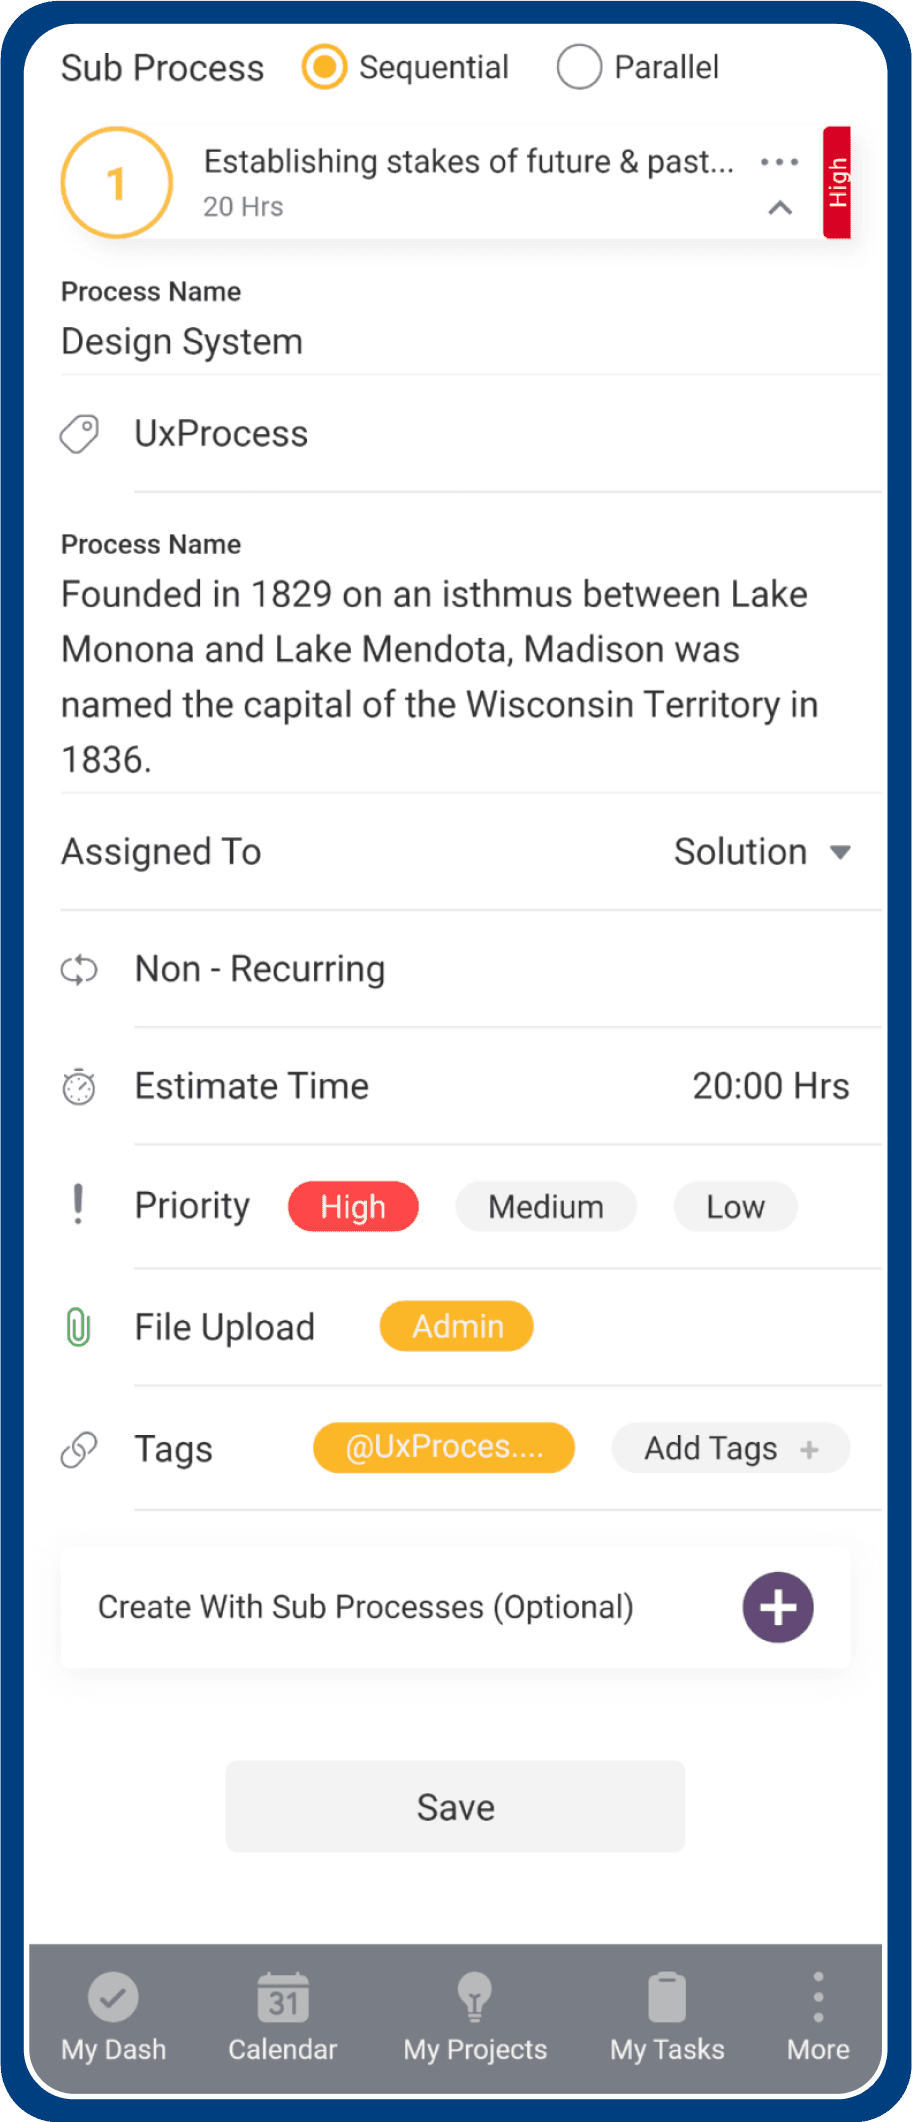
Creating sub process
Where you can elaborate more about process by breaking it in small goals.
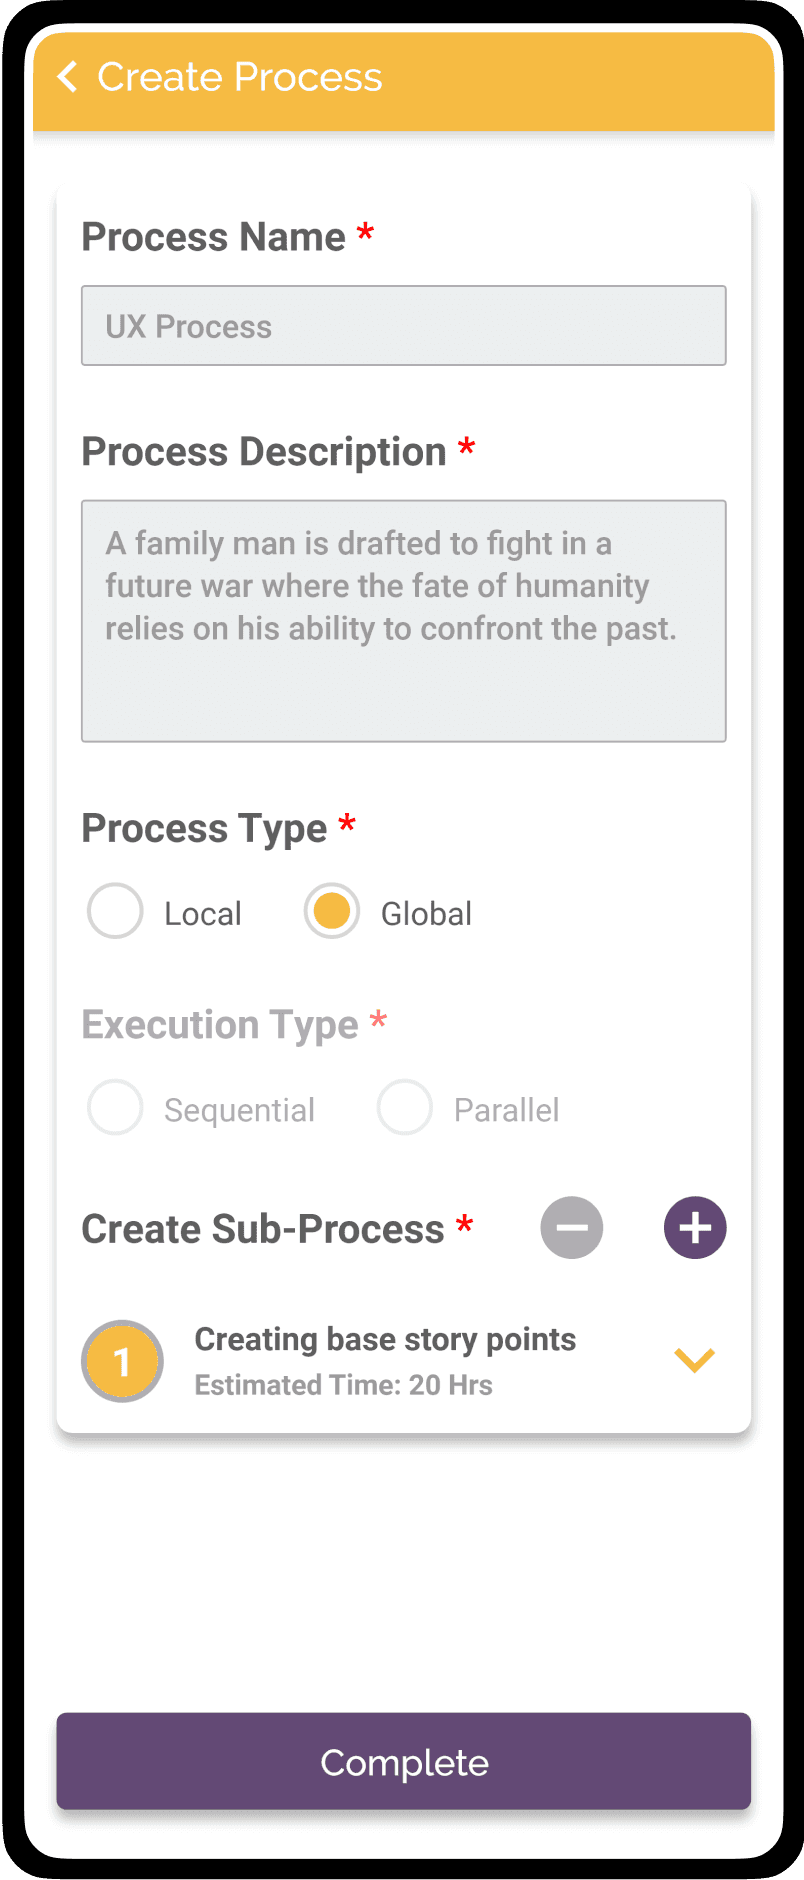
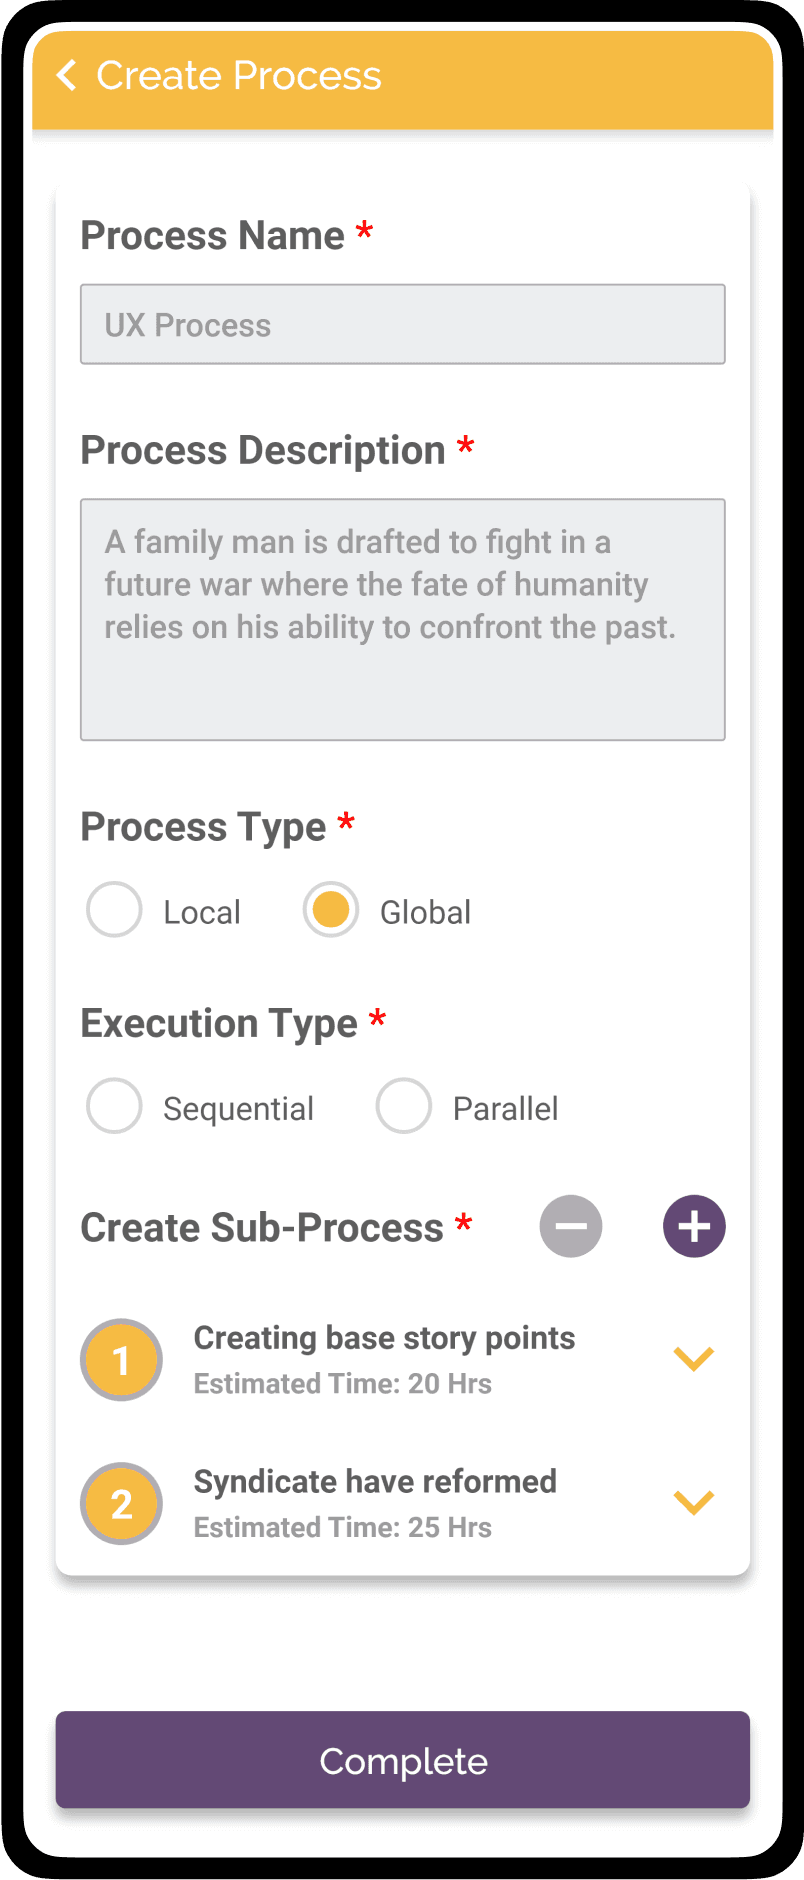
Sub Process
With 2 breakdown
Actionable options
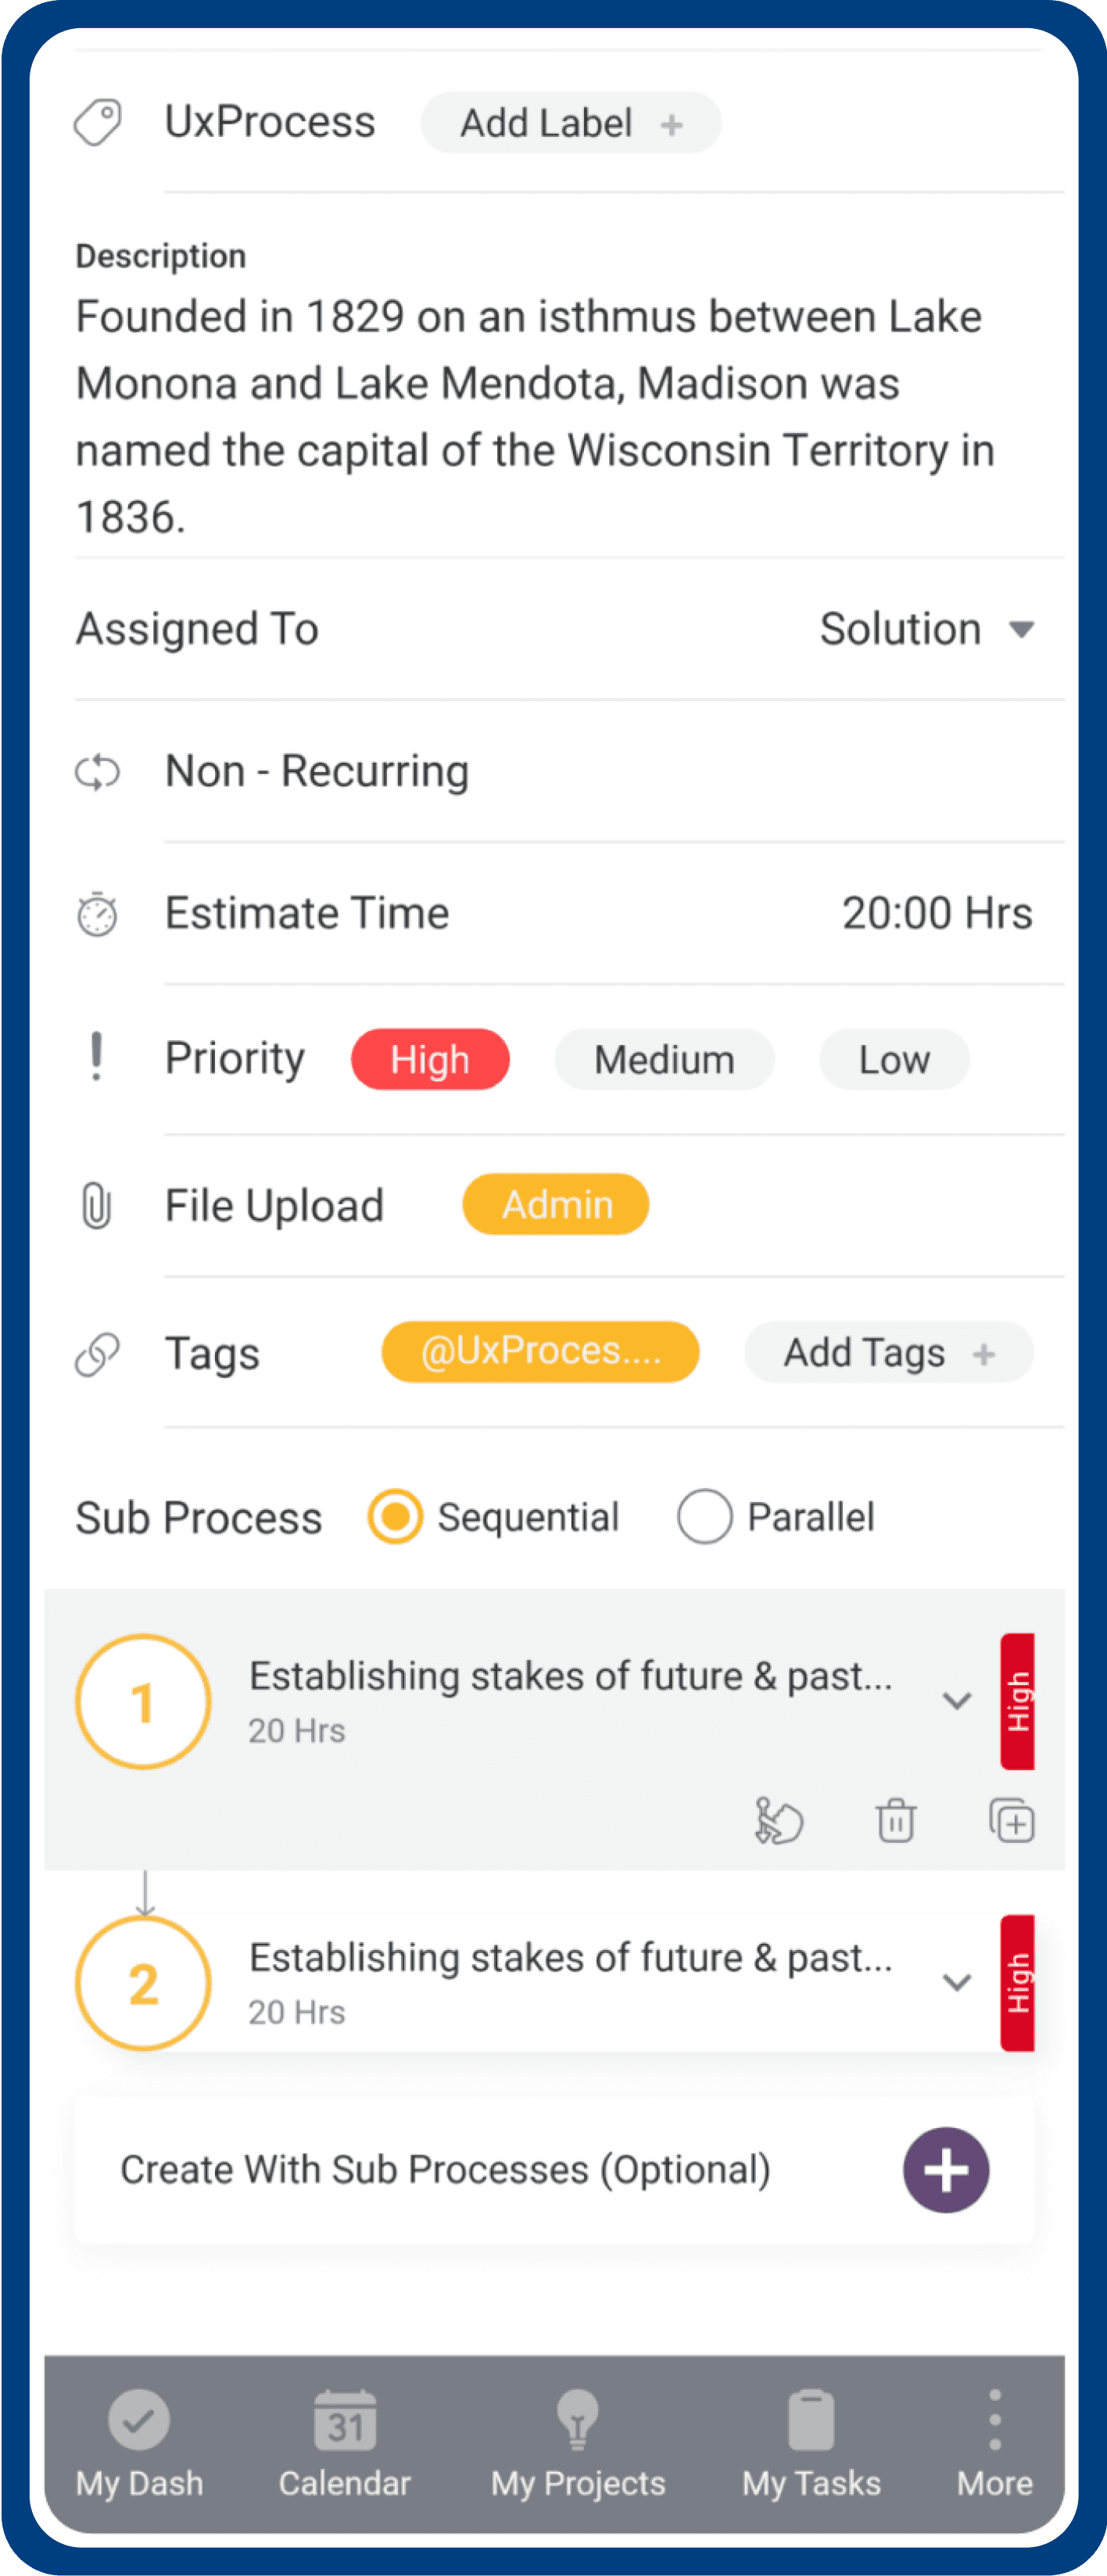
After choosing the execution type, you'll find its 2 sub processes with the option to further break them down.
For seamless management, you can easily change the order, duplicate sub processes, and delete actionable options.
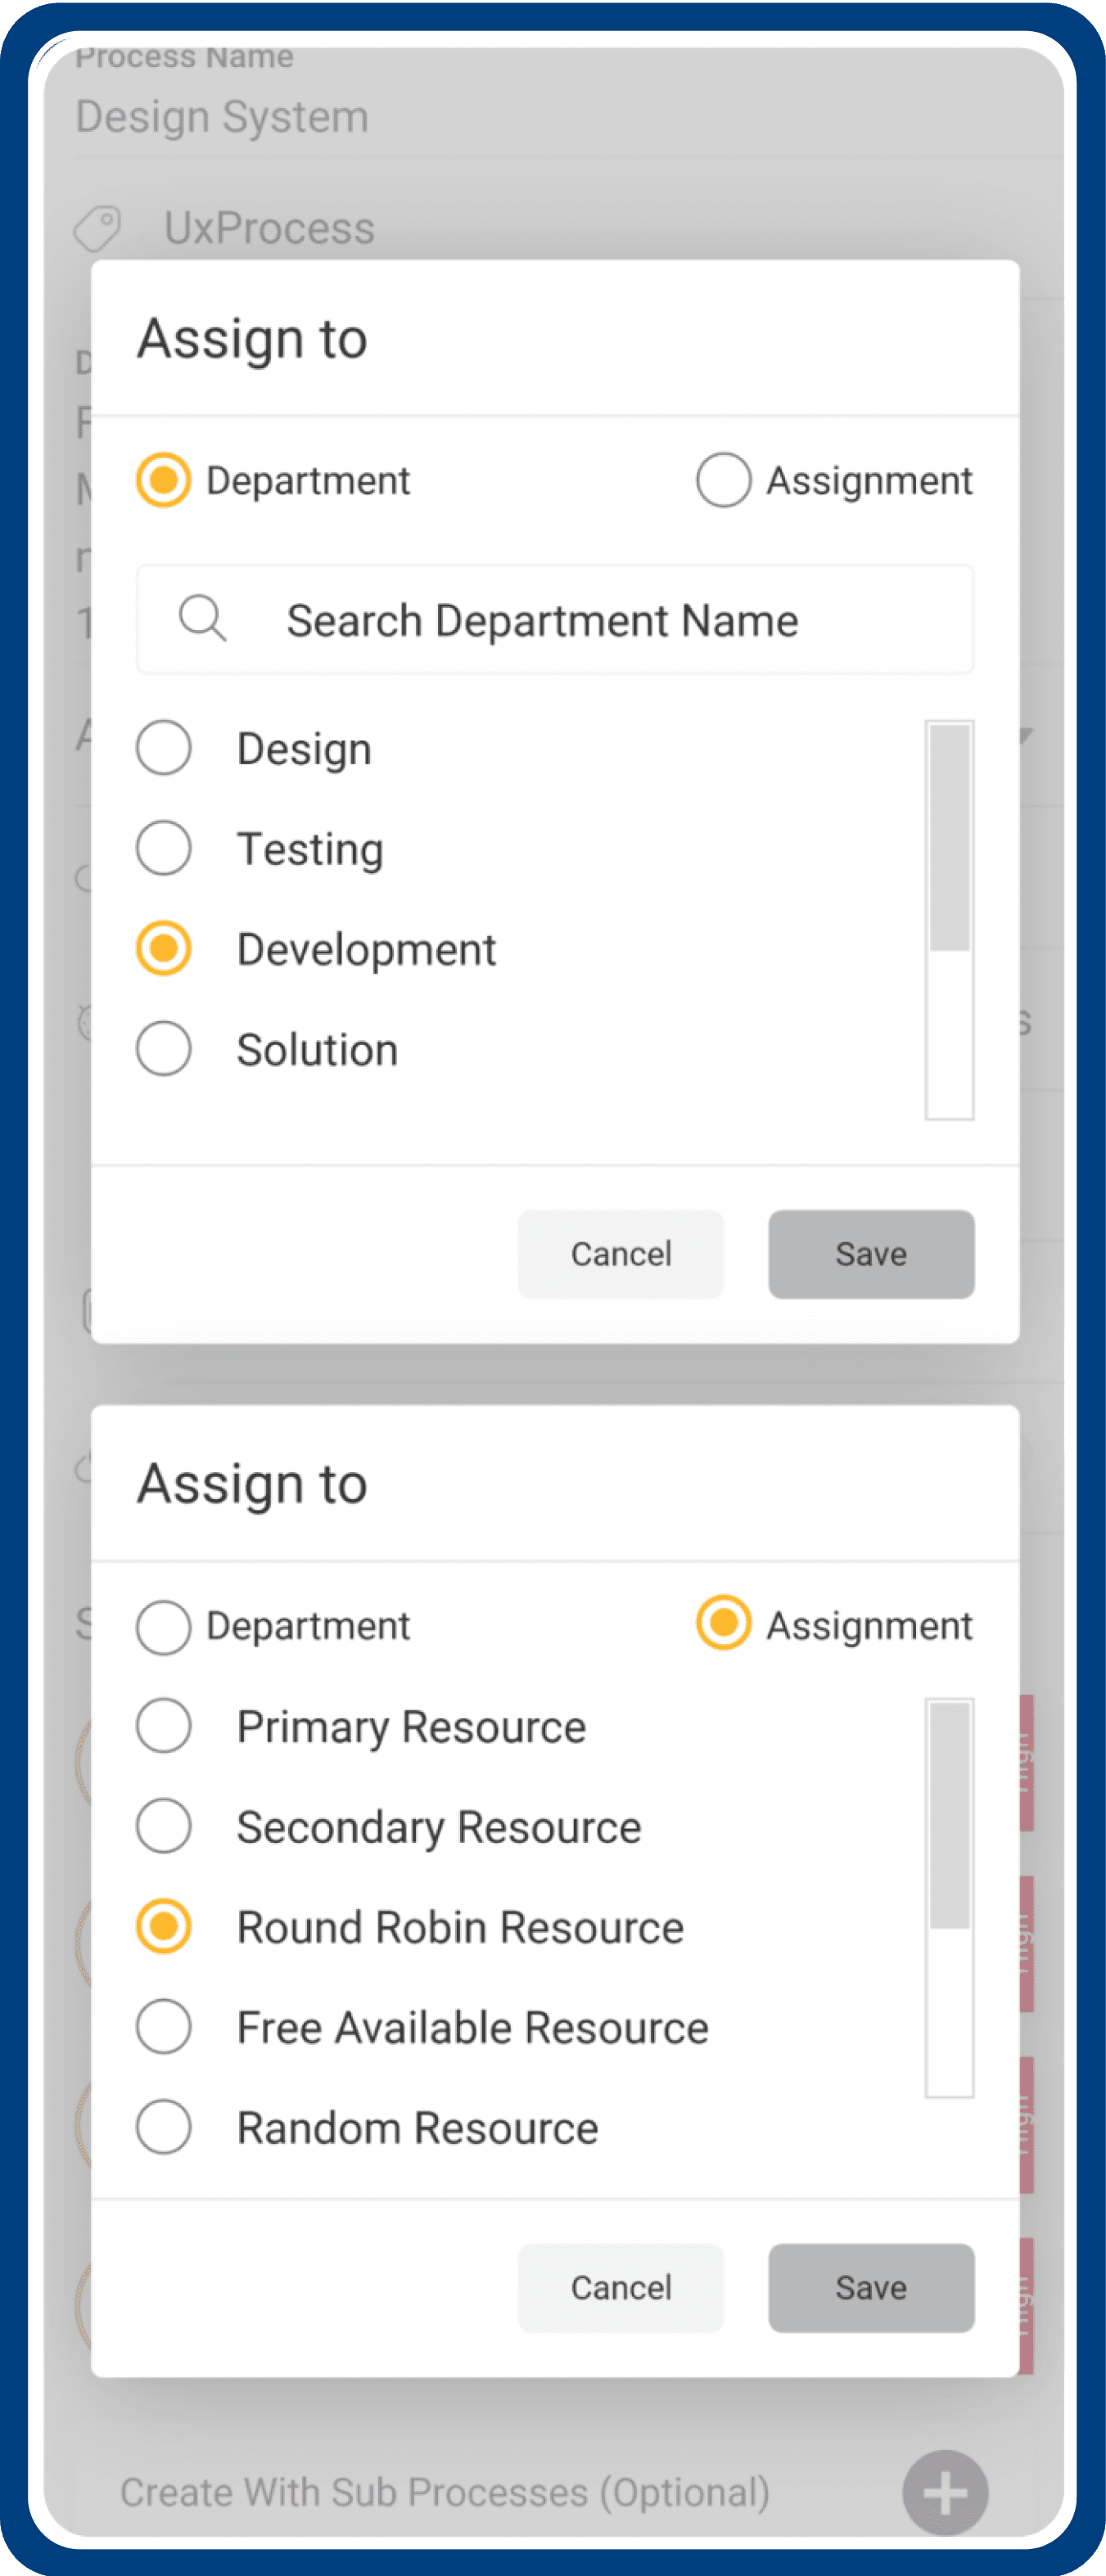
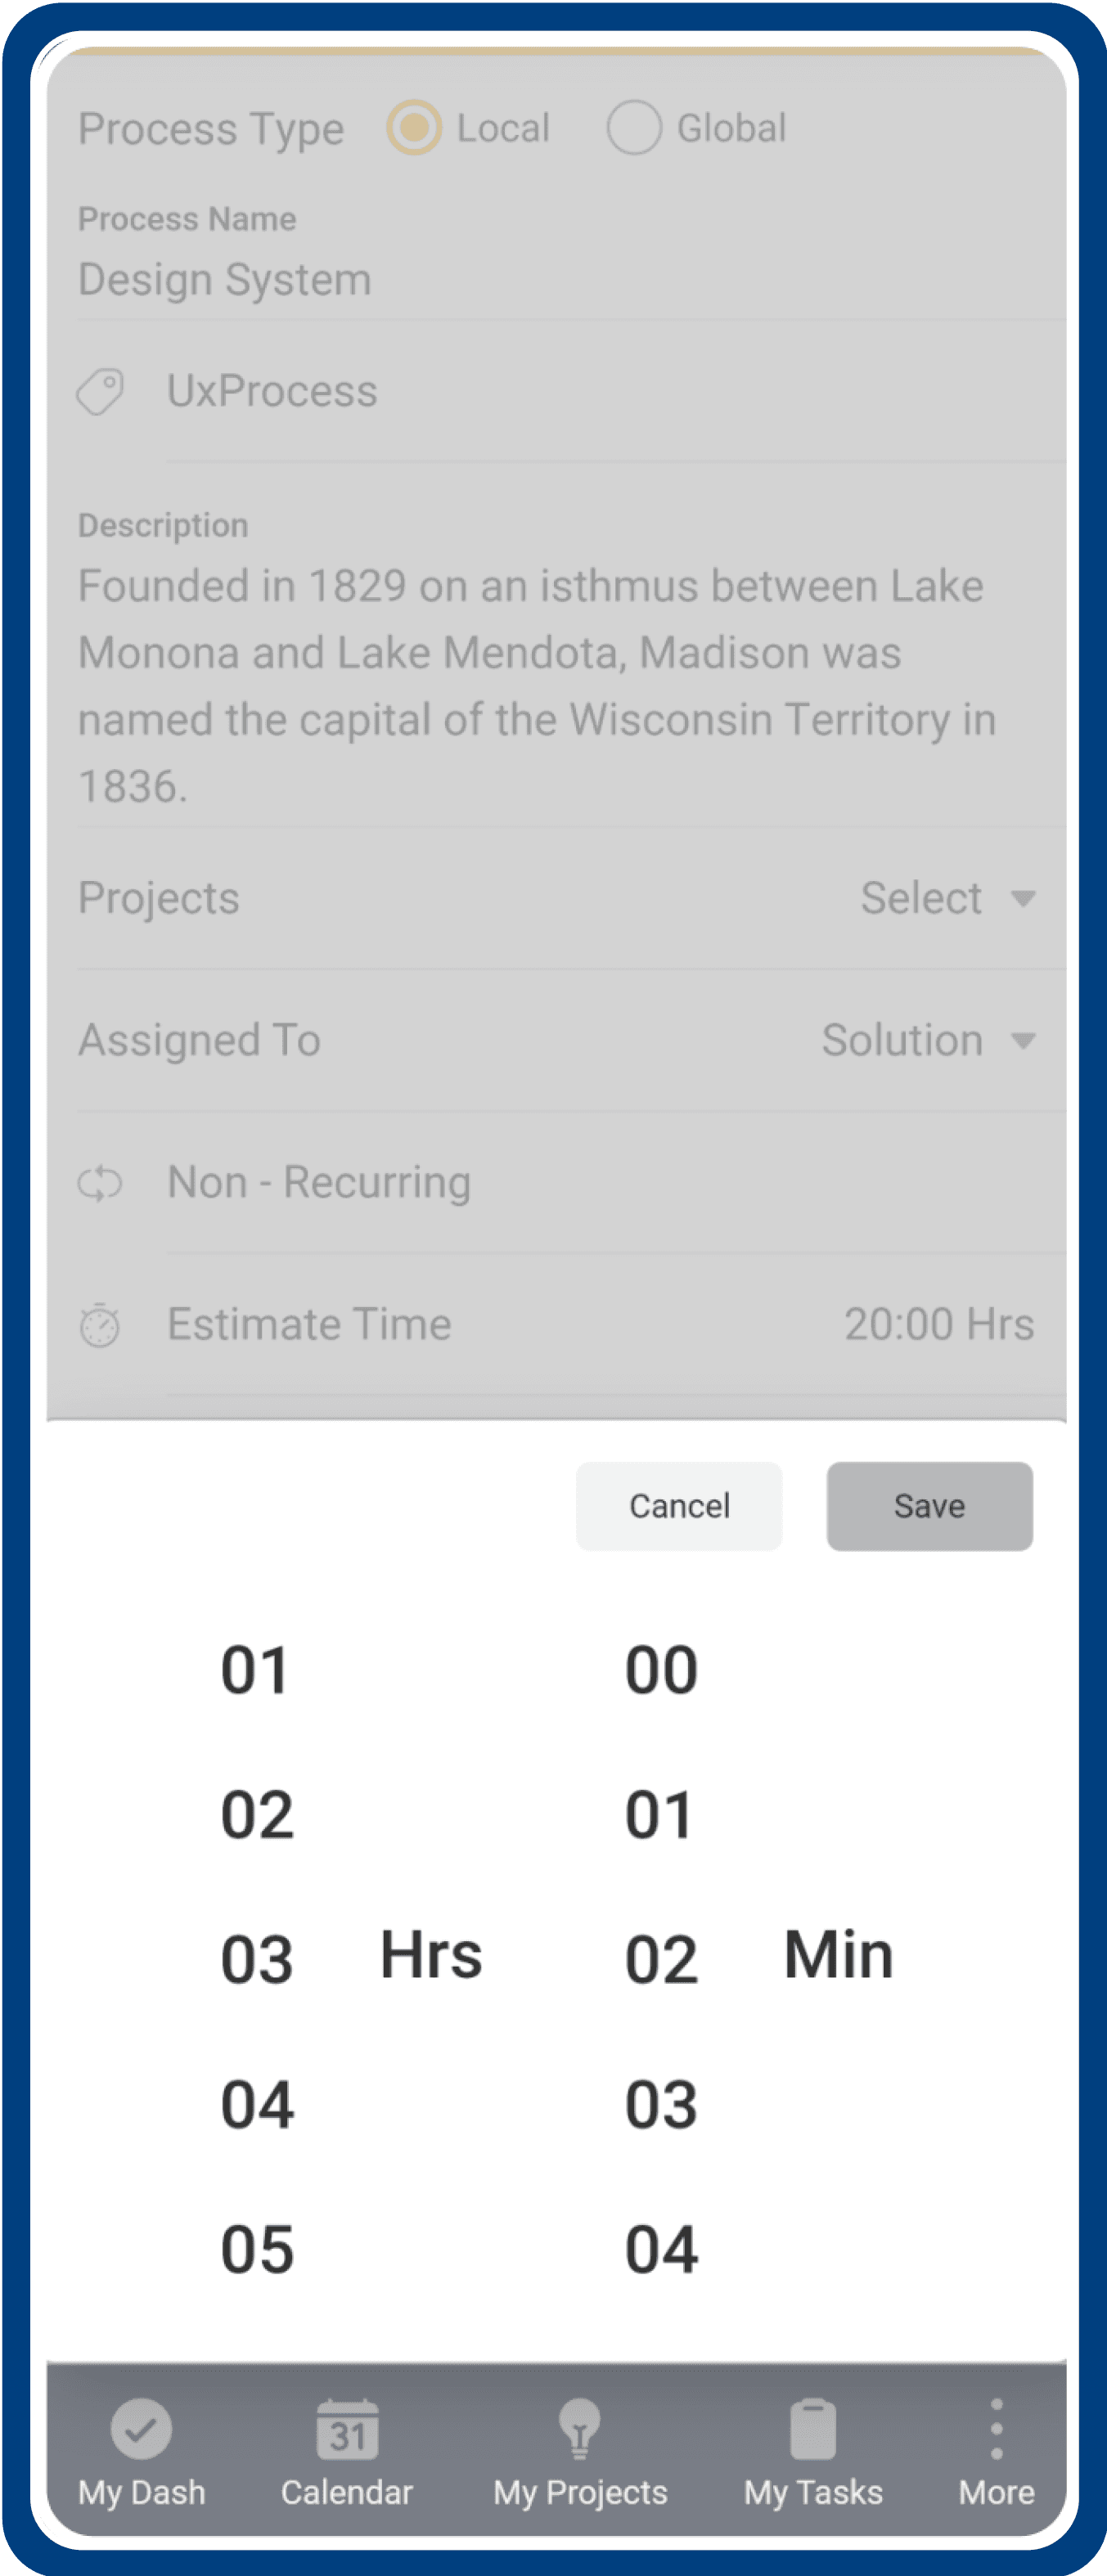
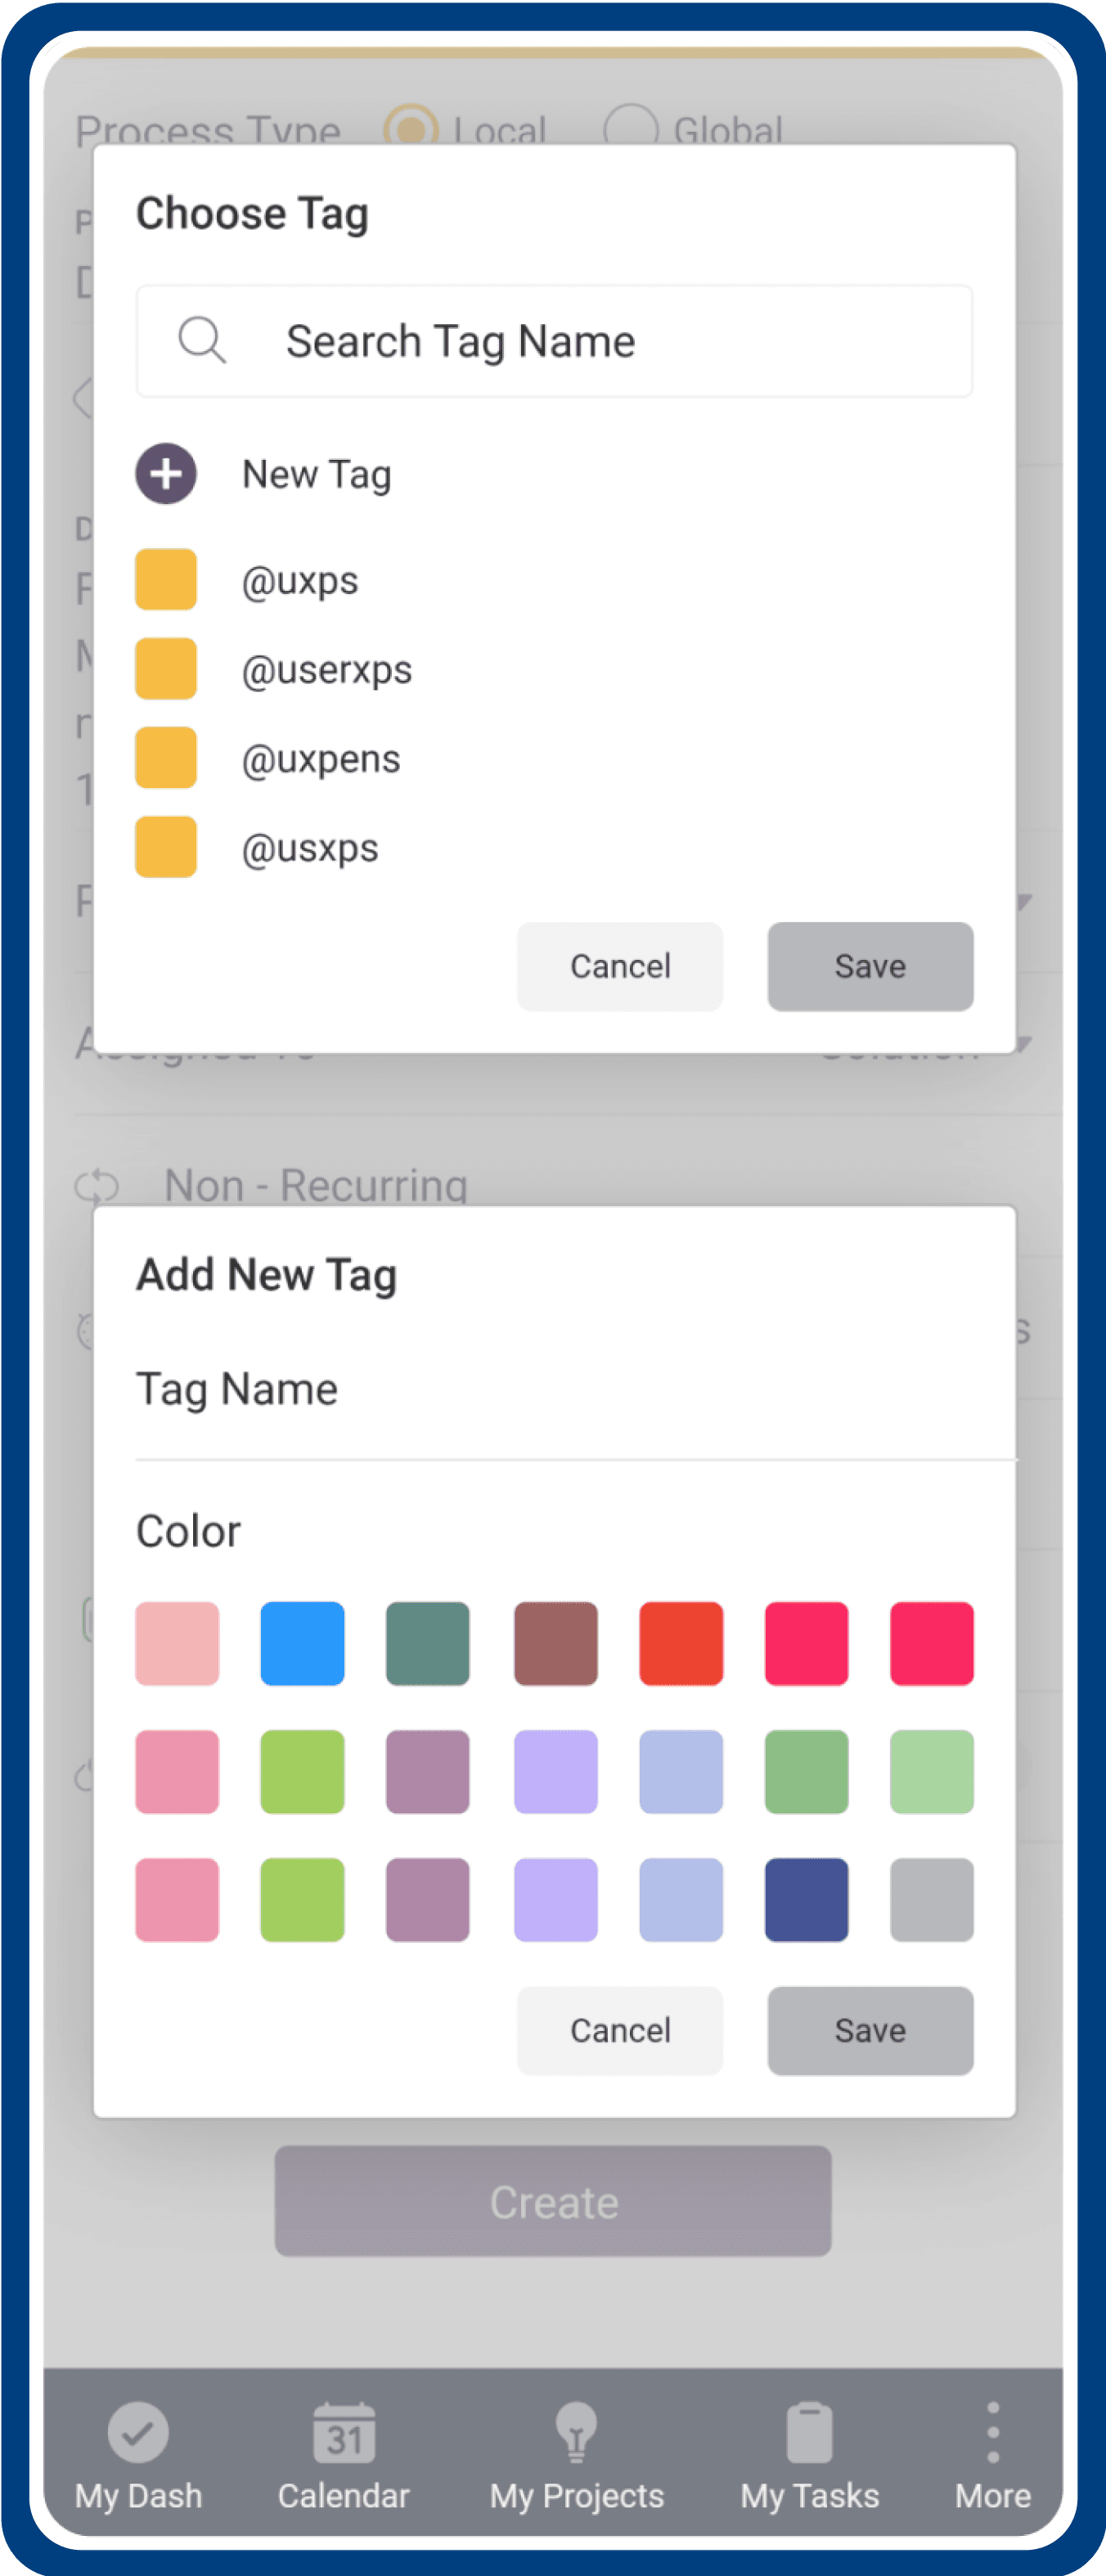
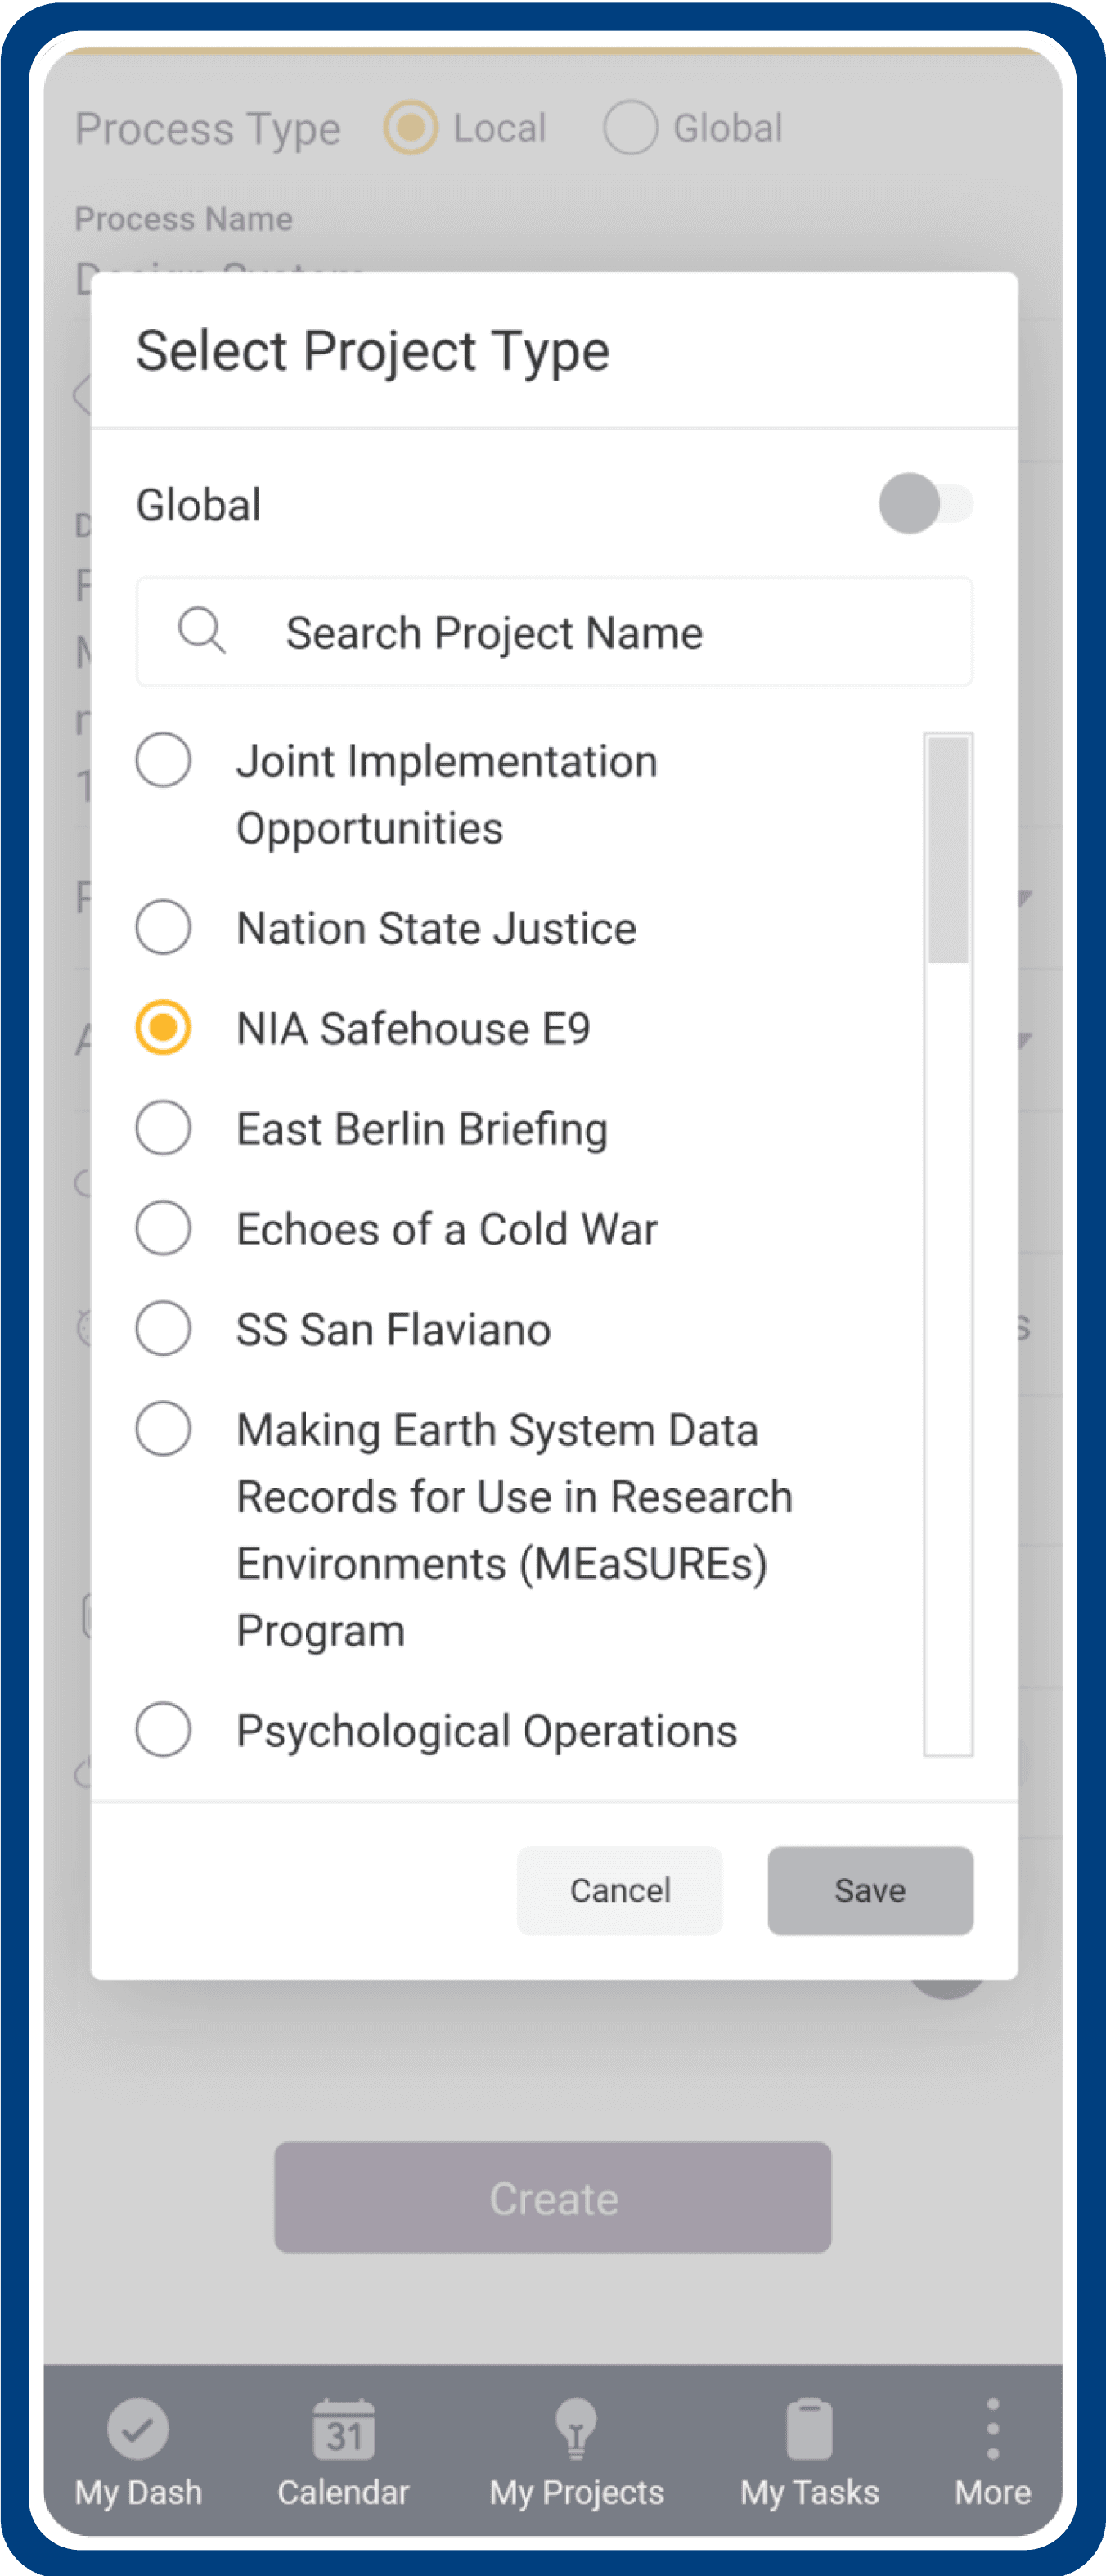
Process Actionable Items
Assigning Teams
Estimate time
Access file upload
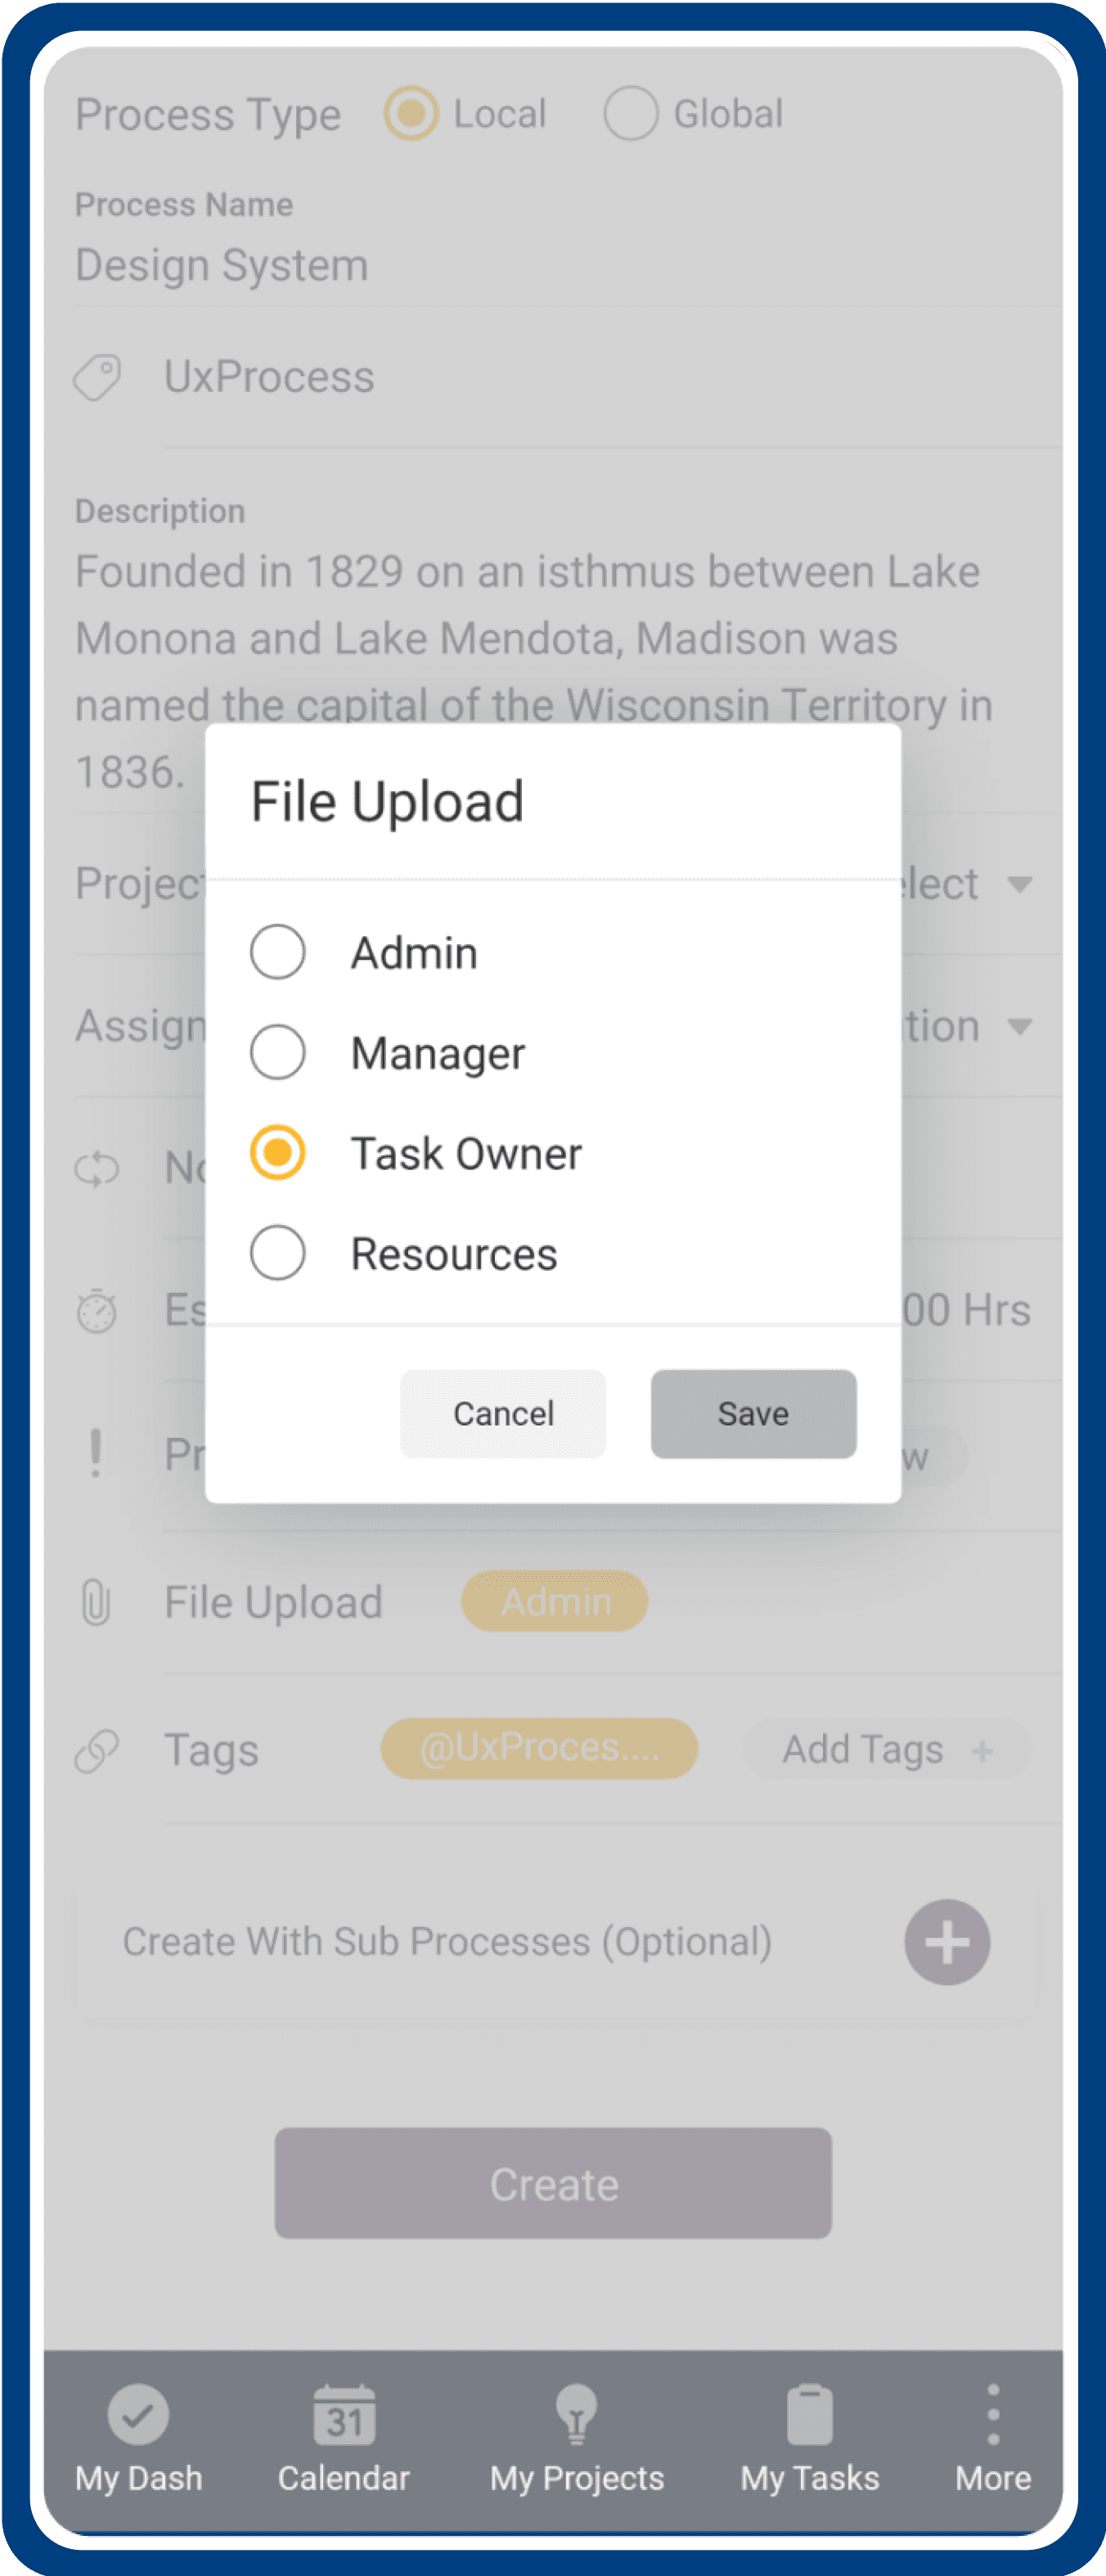
Add or Select tag
Select project type
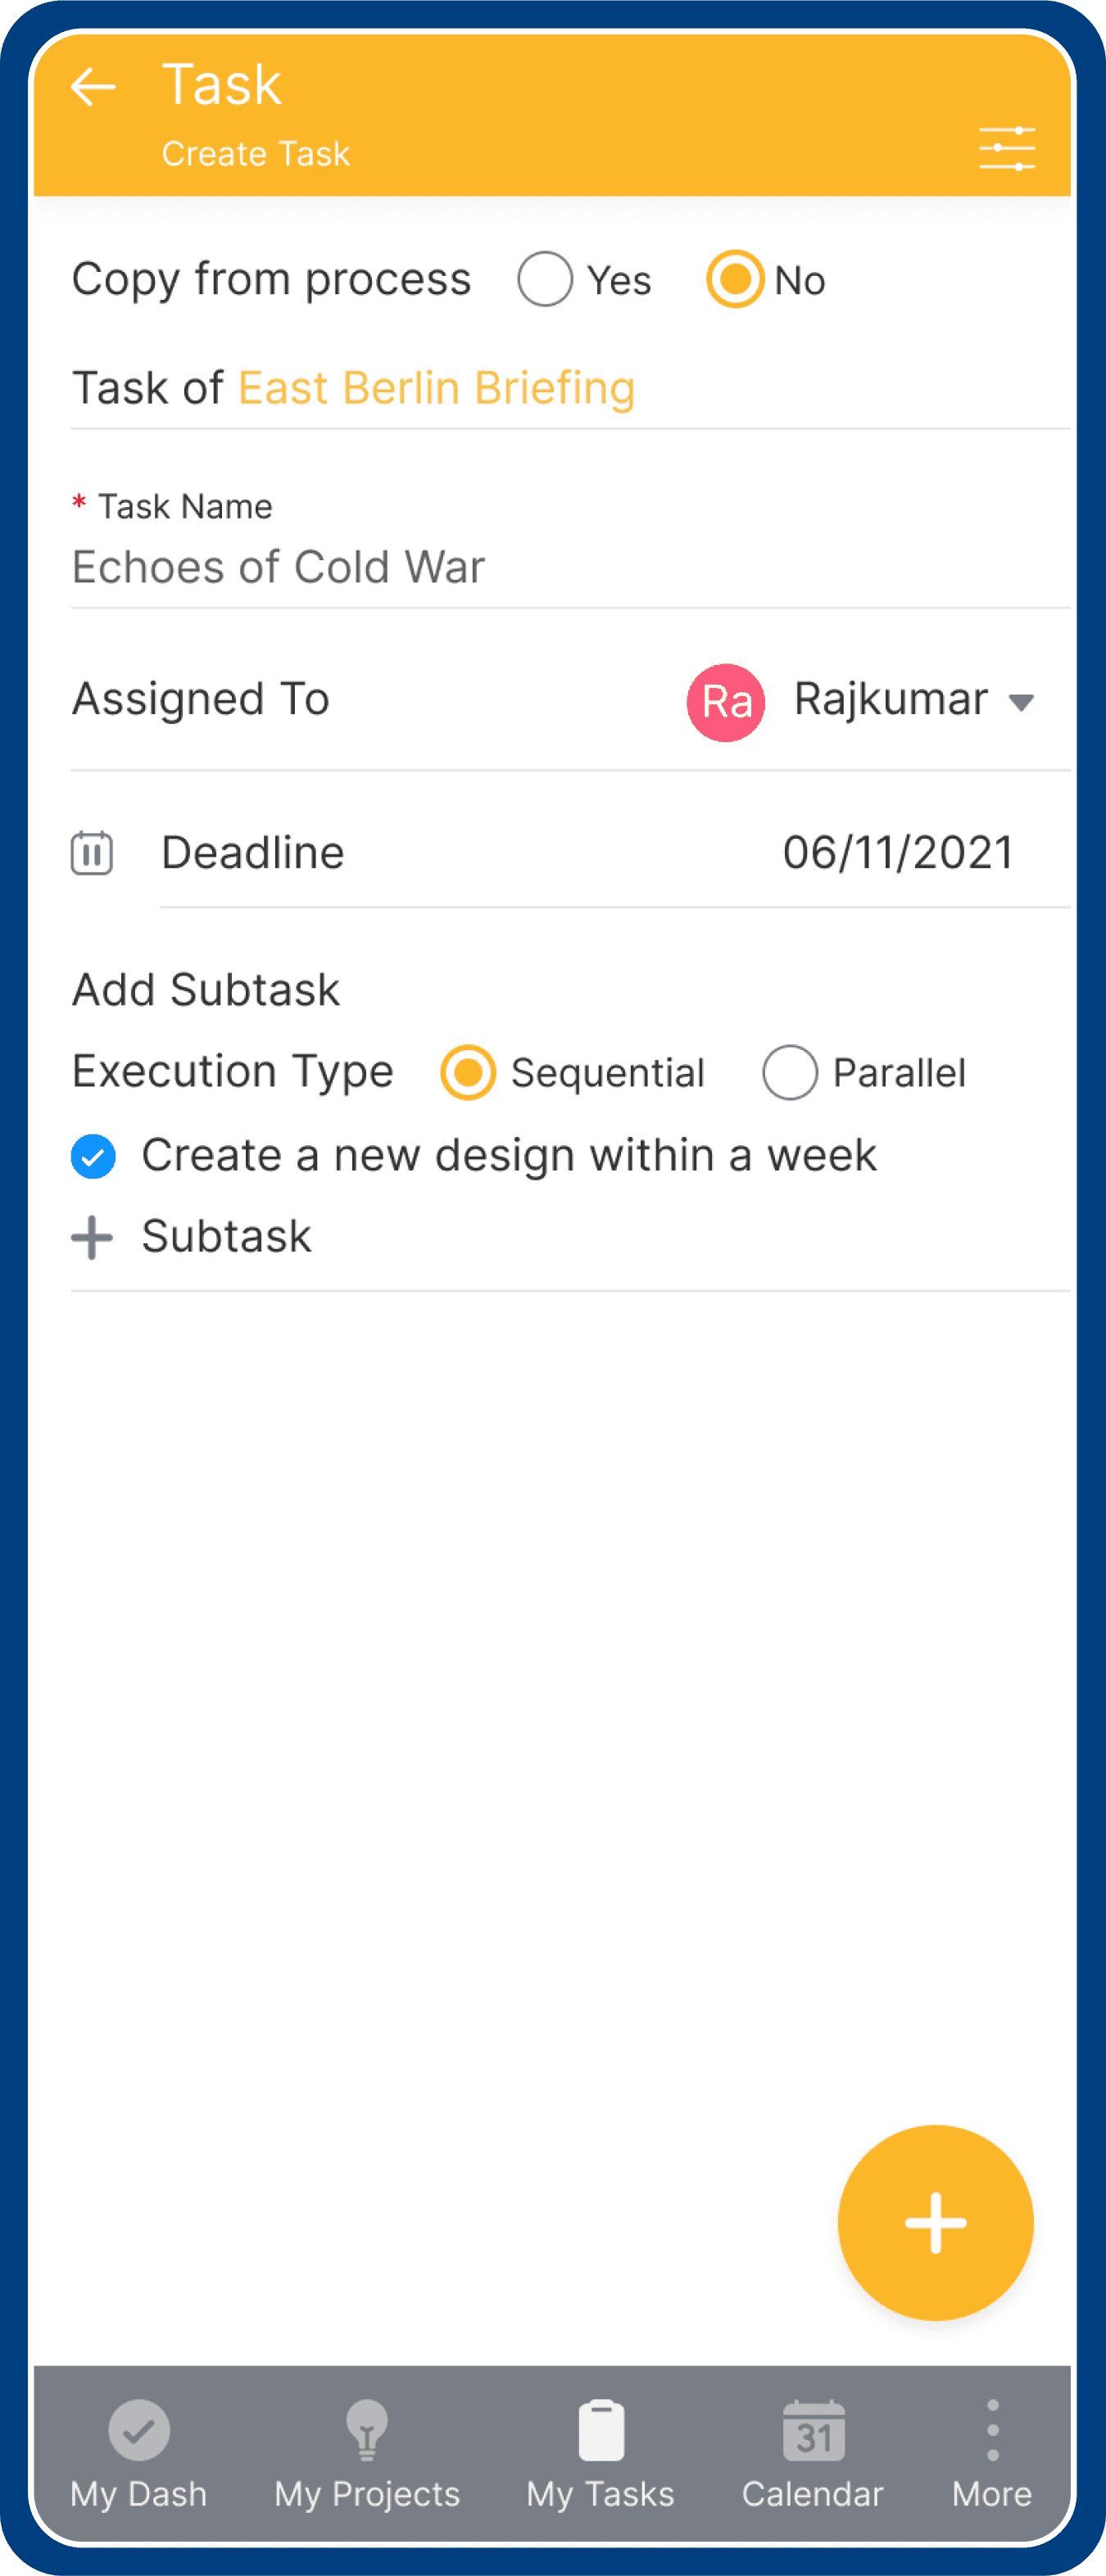
Task & Subtask
Friction less Creation
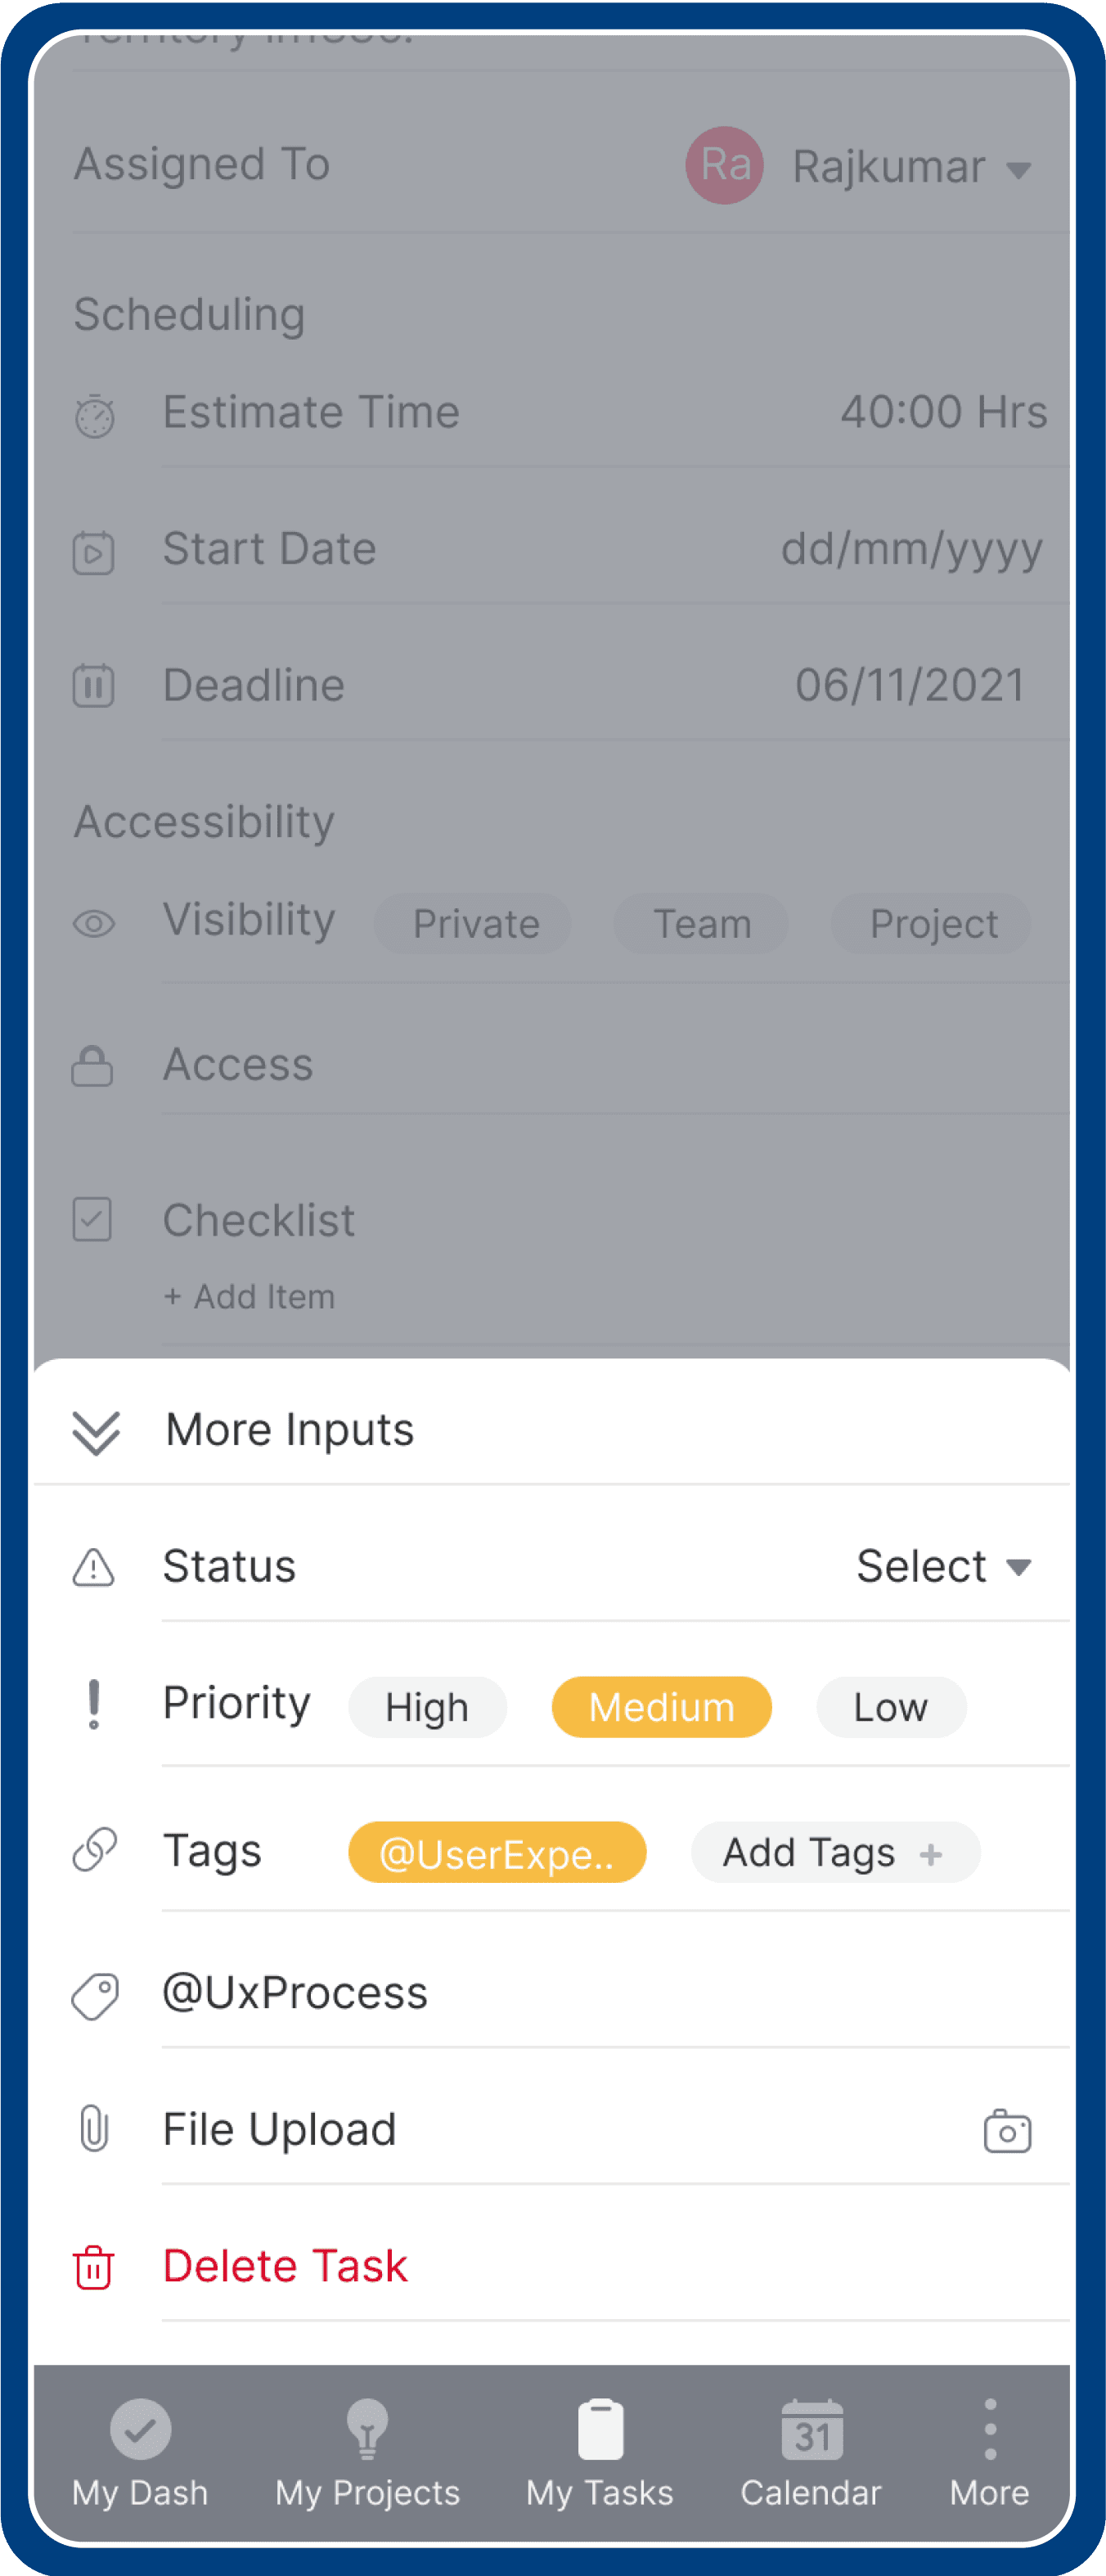
The most common element within the application is task and subtask creation. To enhance usability, we have streamlined this process by employing only the primary input details on the page. This minimalist approach allows users to create tasks and subtasks effortlessly. Additional details can be added after creation, catering to user preferences.
Creating Task & Subtask
Empty fields
Field Form
With Sub Process
Task Creation Options
Task can created with new set of details or select “copy from process” to inherit the data like task execution details from process. Task can be created as single type or with the subtask.
Execution Types
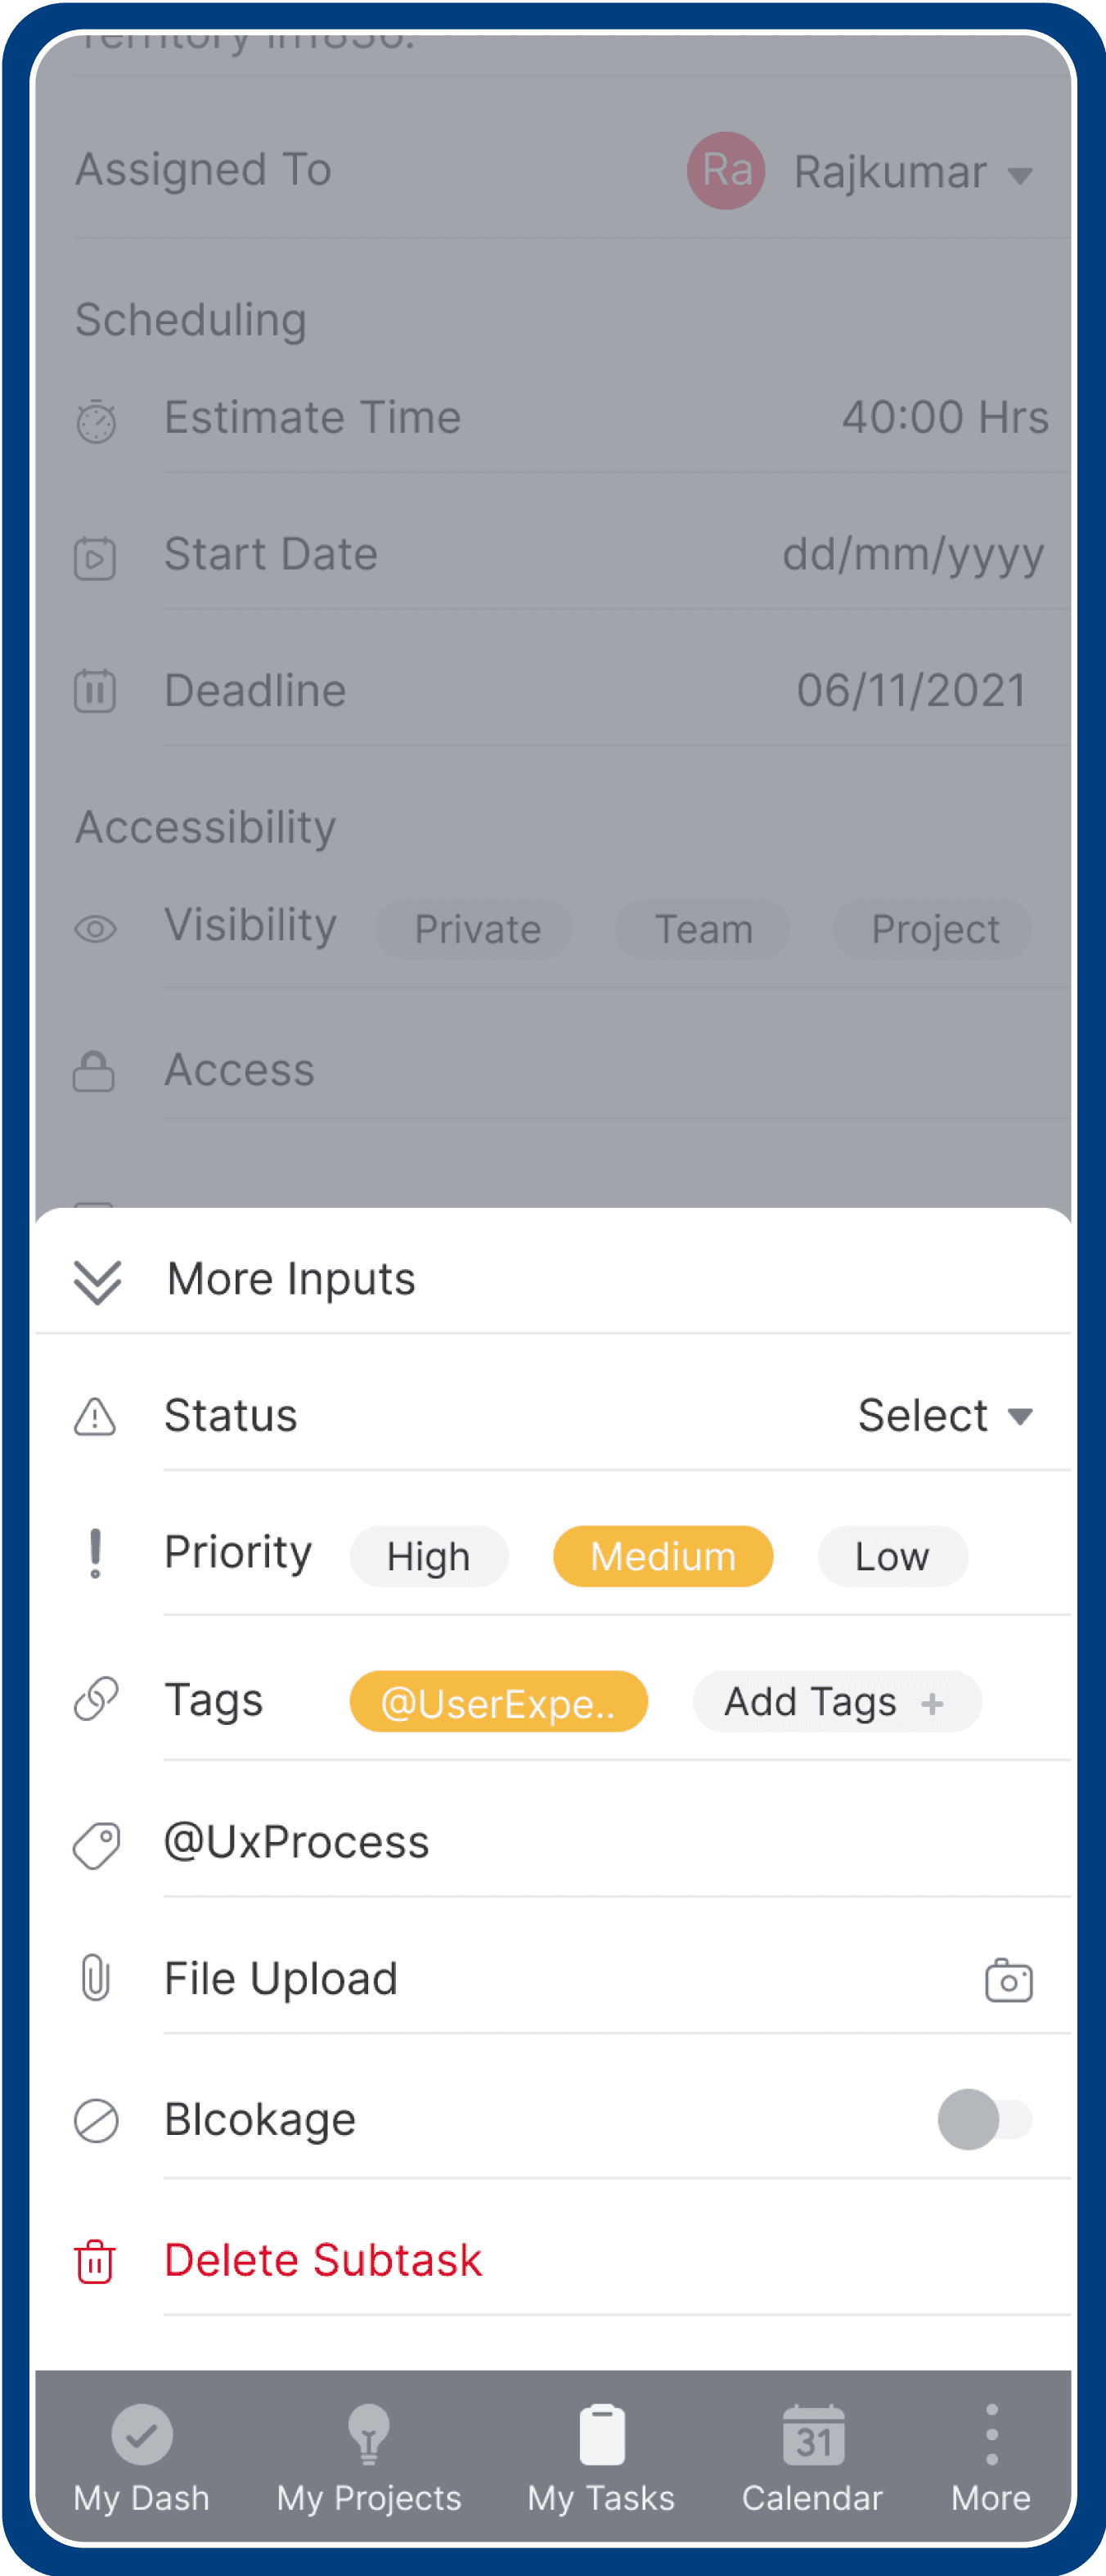
Two execution modes exist: sequential and parallel. New subtasks are added using the "subtask add" icon.
Process Actionable Items
2 breakdown
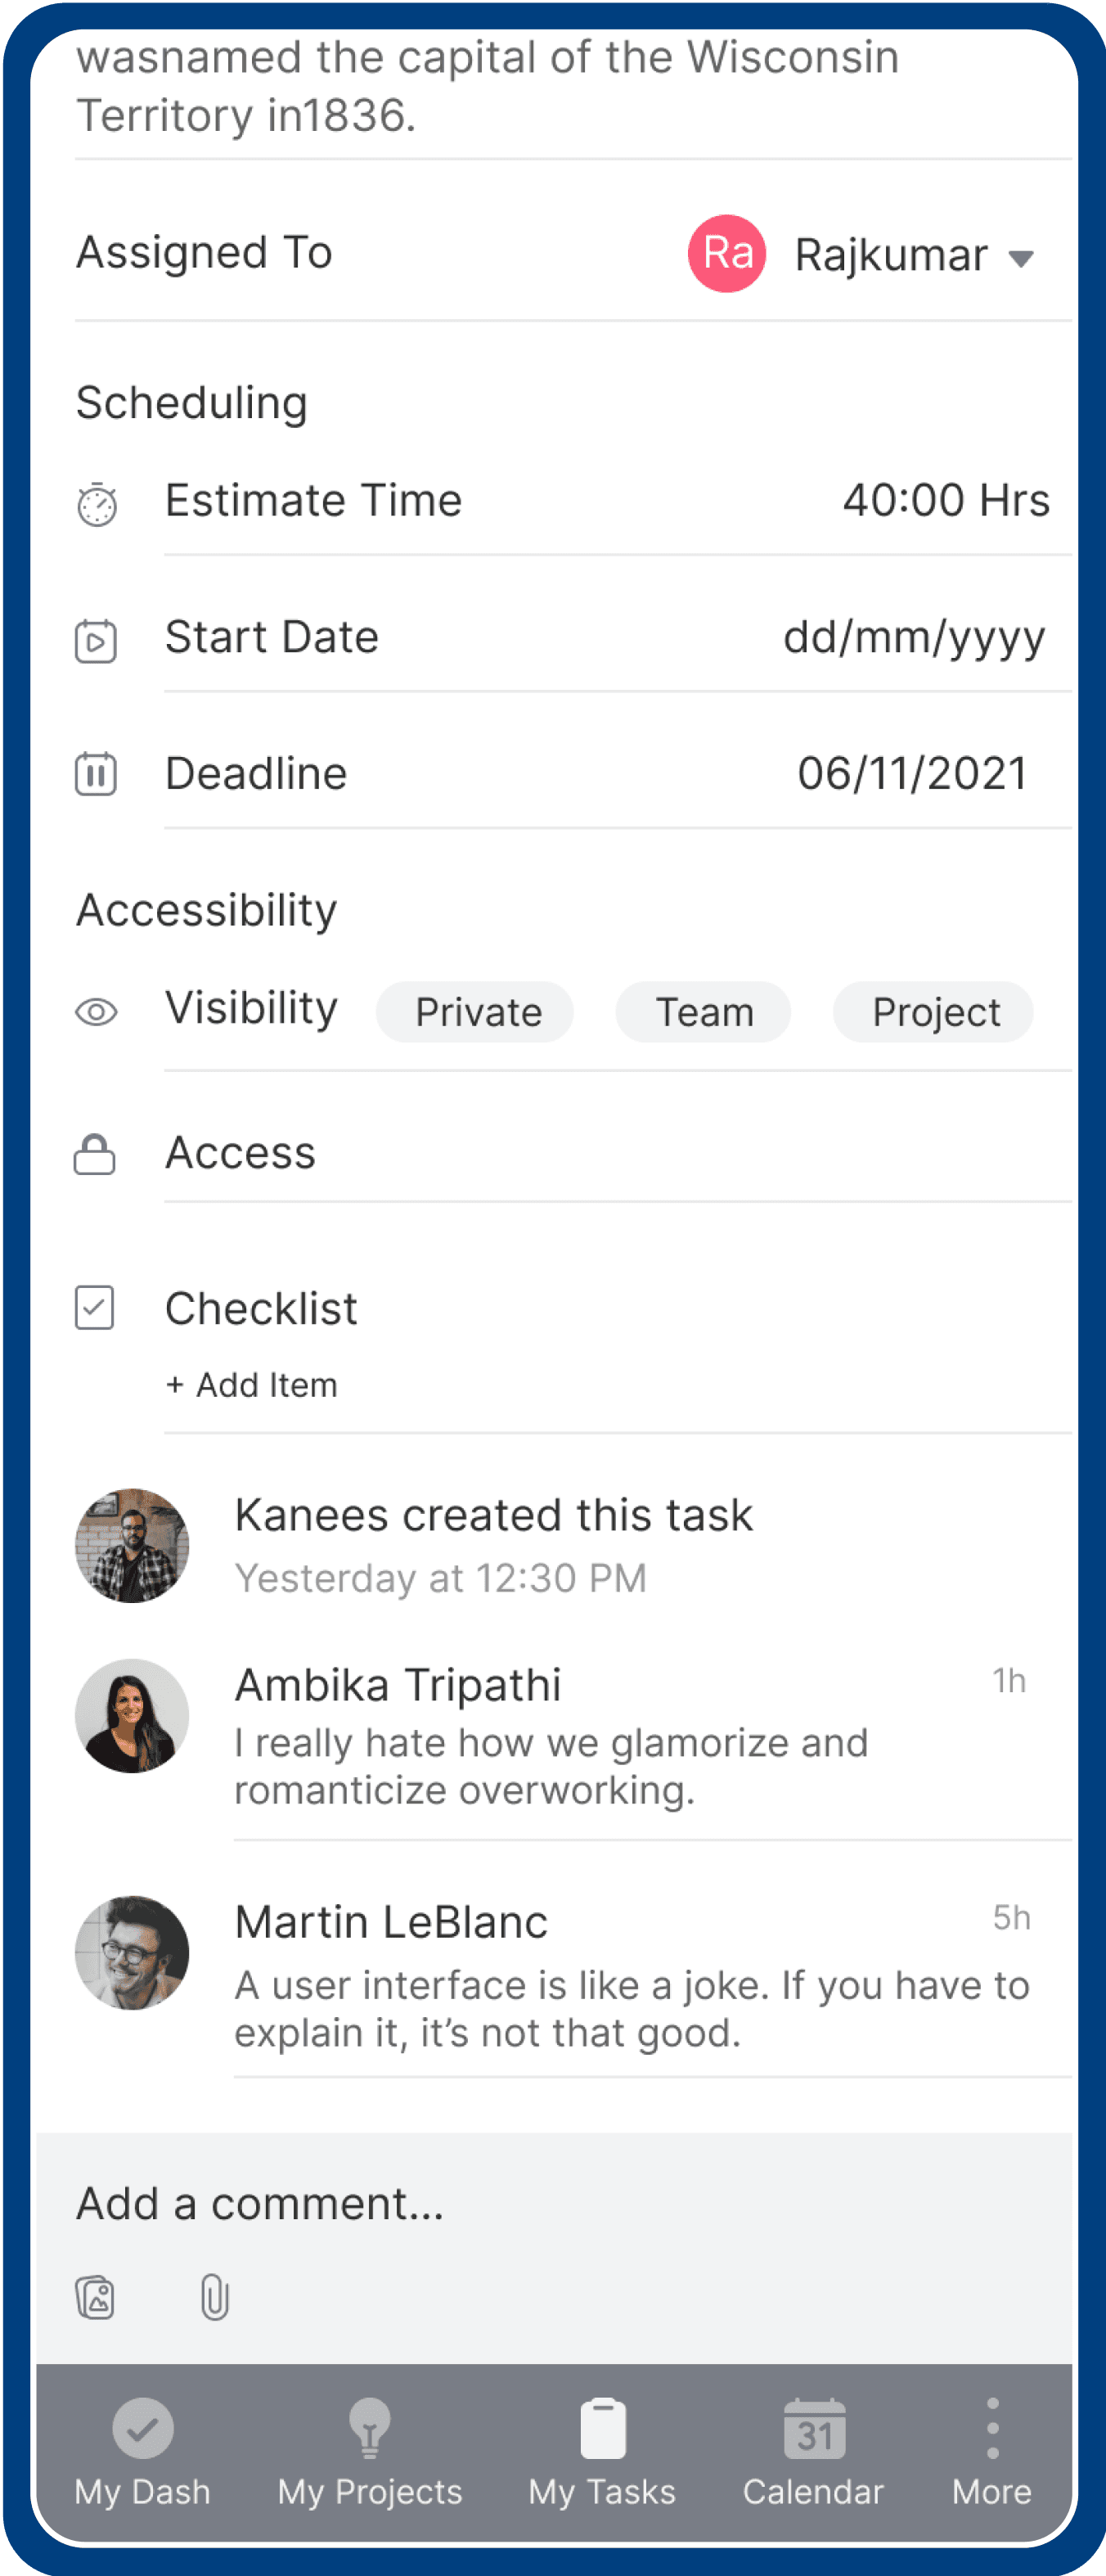
Task View
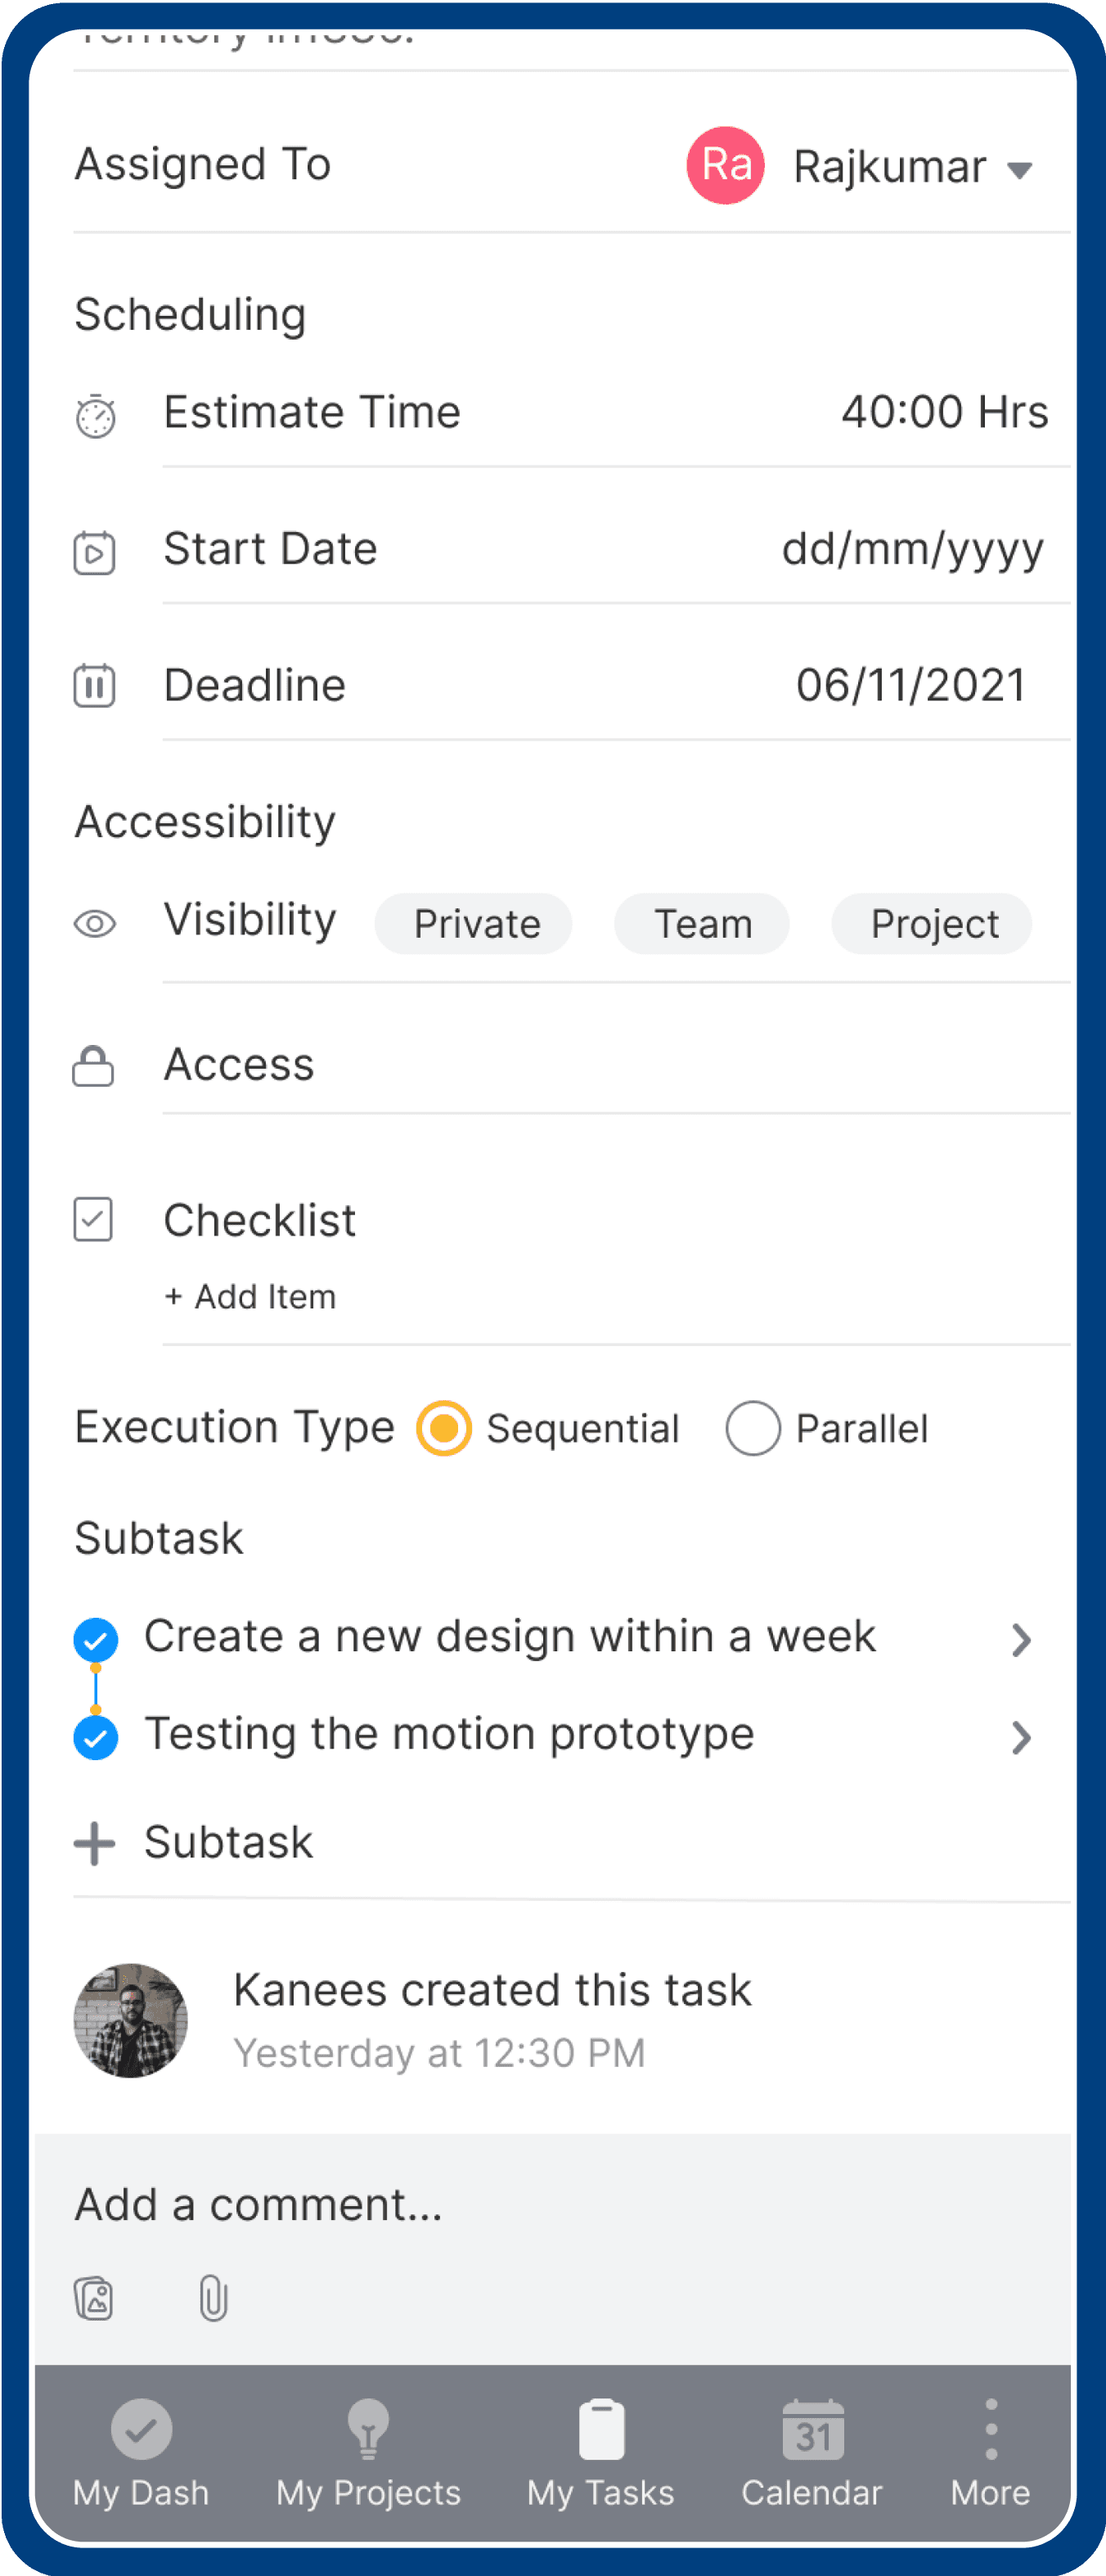
Actionable options
Comment options
More input options
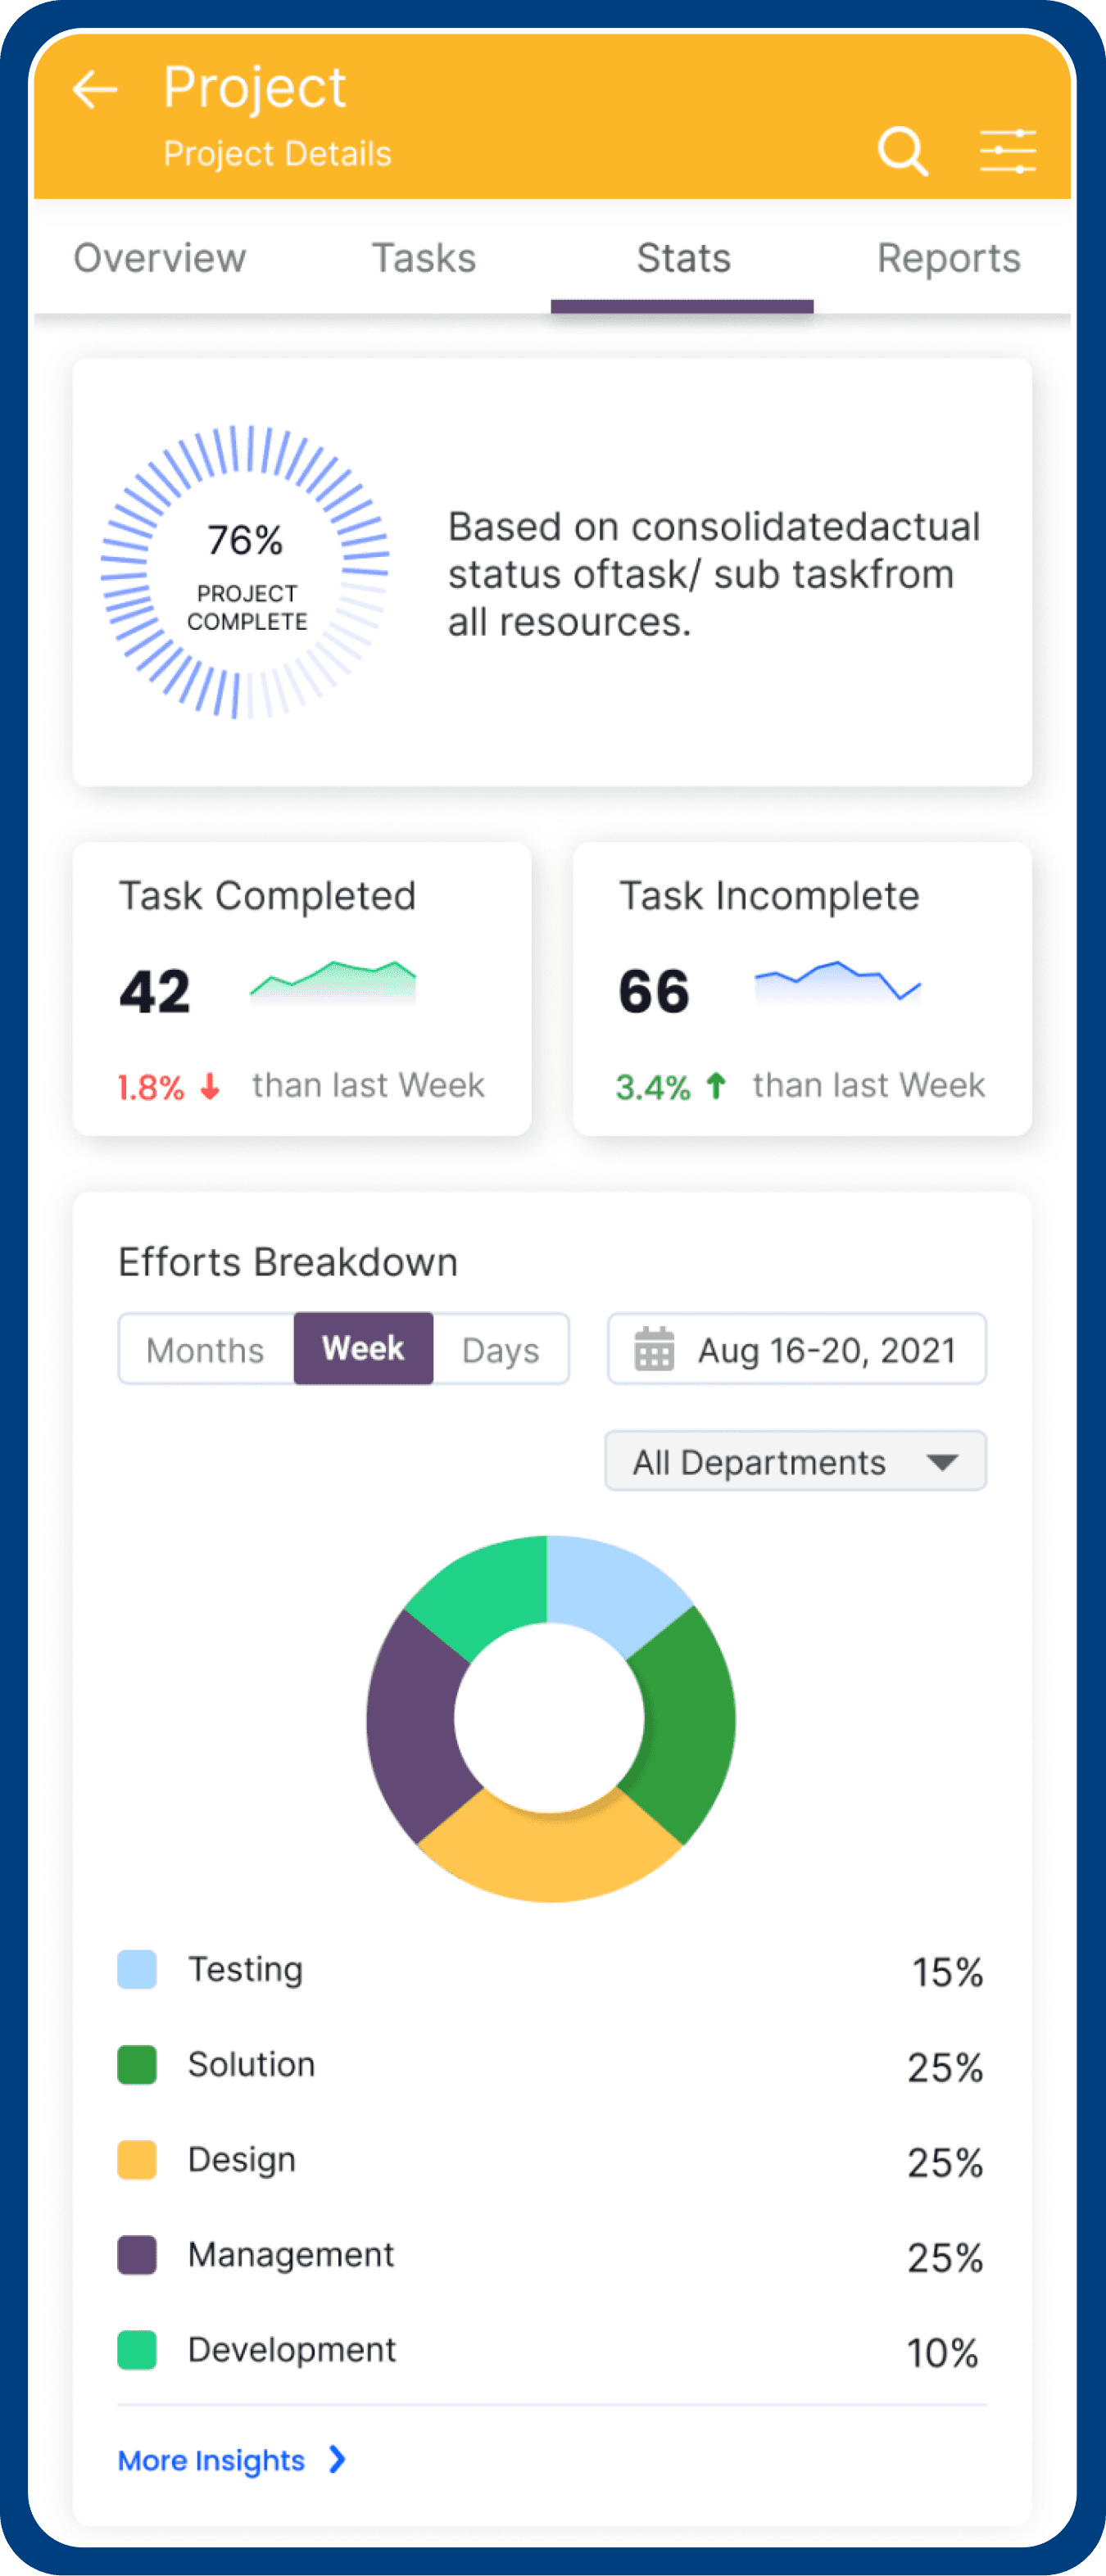
Project Overview
Almost every single enterprise product has an analytics module, and consequently, a dashboard. But what makes a useful dashboard? After doing a bit of research, I took away 4 principles of good dashboard design:
Provide relevant information in about 10 seconds of scanning through the page.
Display information in a logical layout: Current insights → trends → drill down.
Have only about 5–9 visualizations at a time: Reduce cognitive load for the user.
Use the right data visualization.
User should get information about anomalies of the system from the Dashboard.
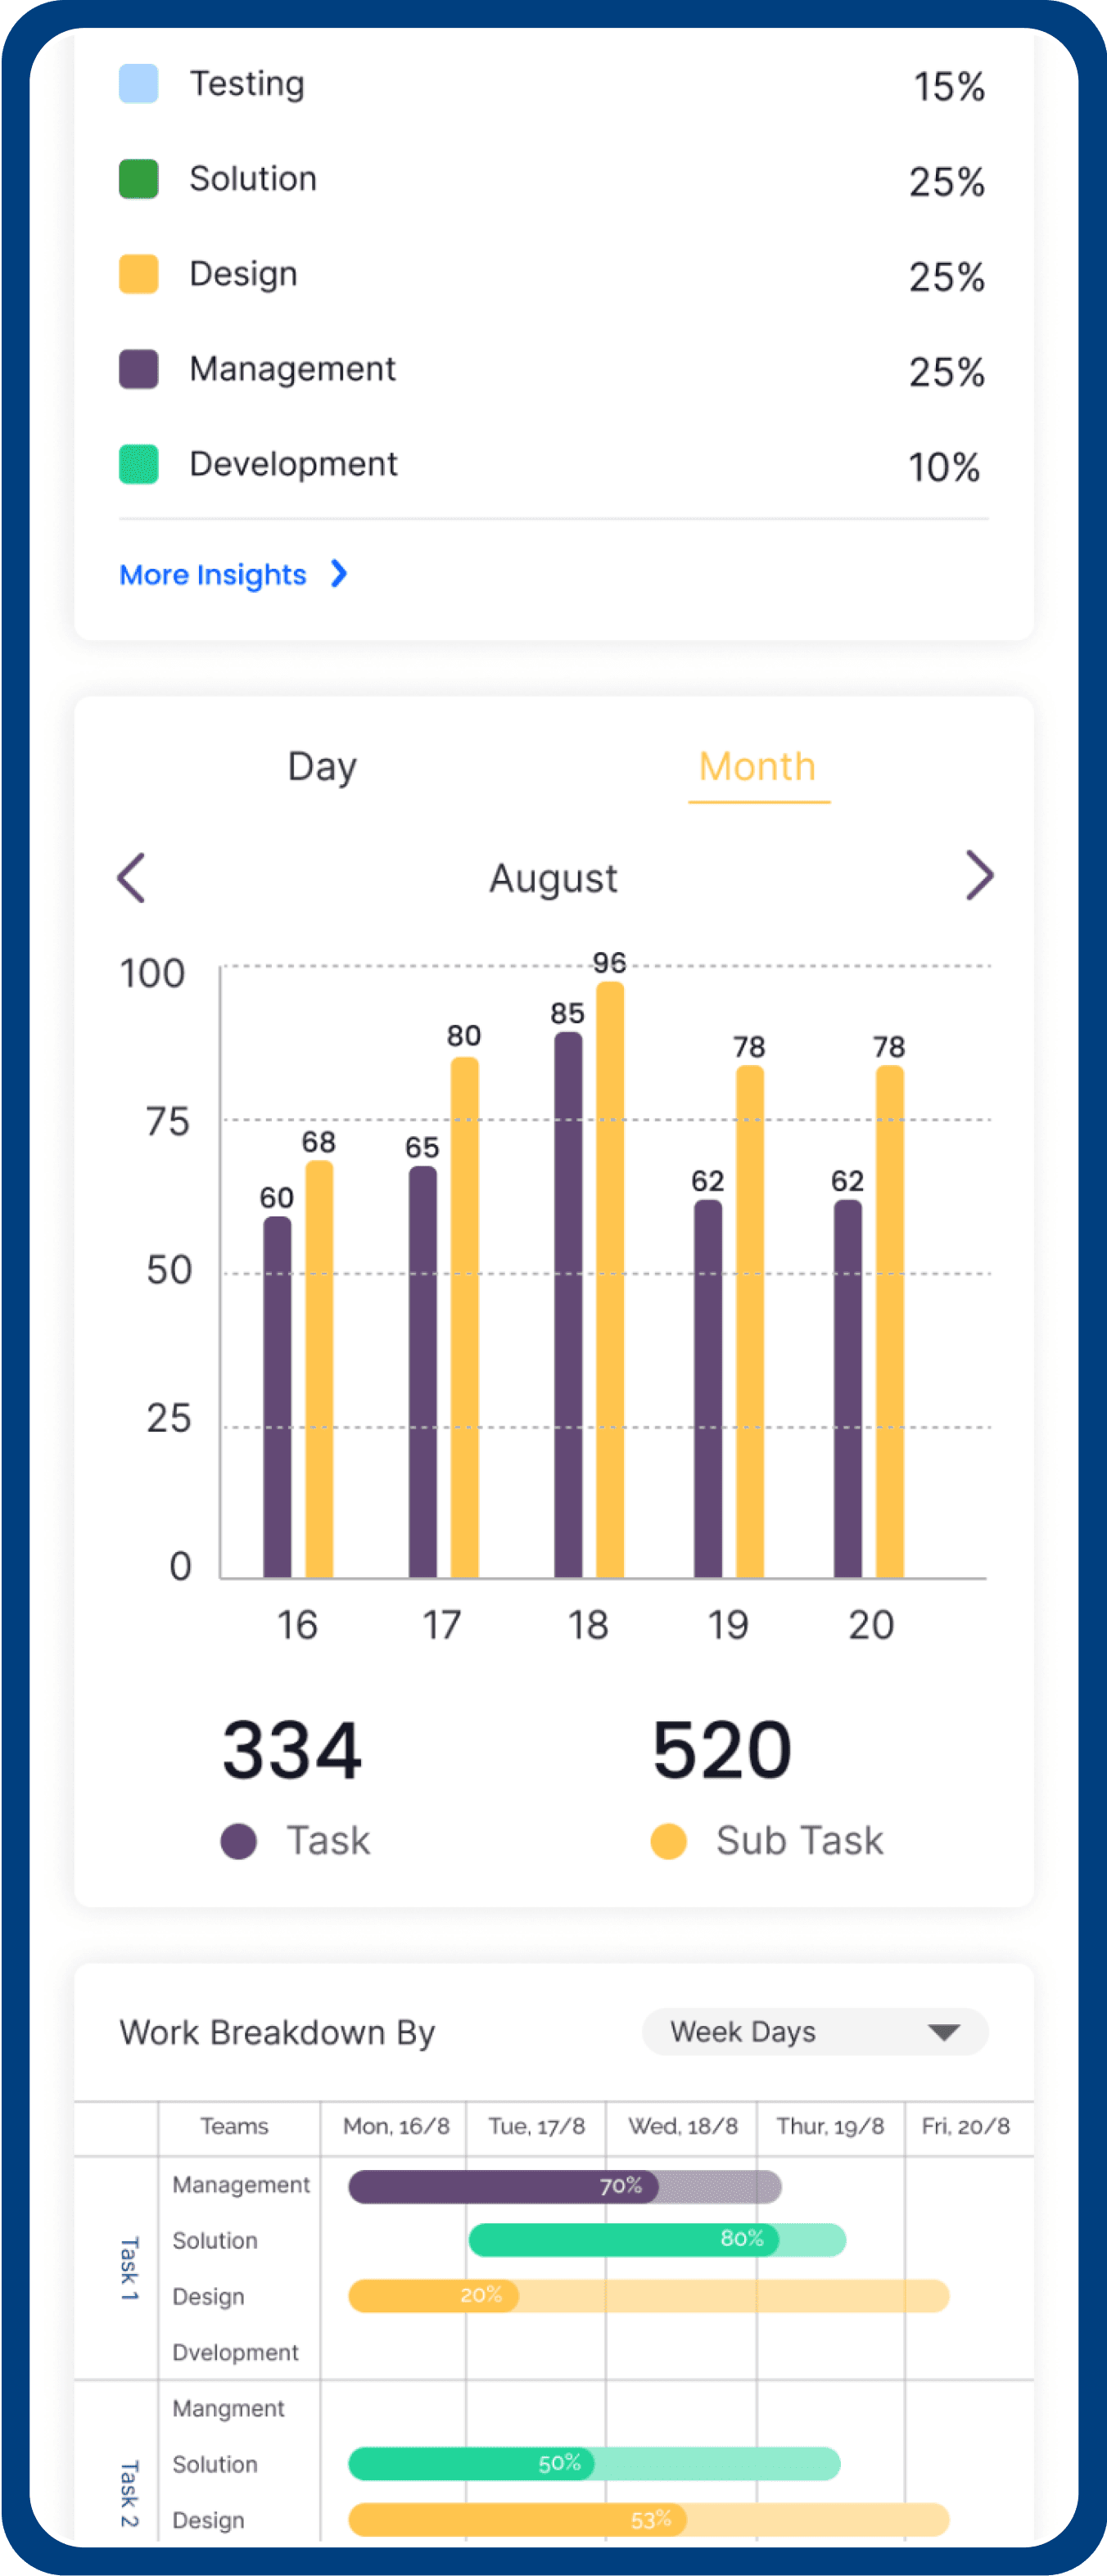
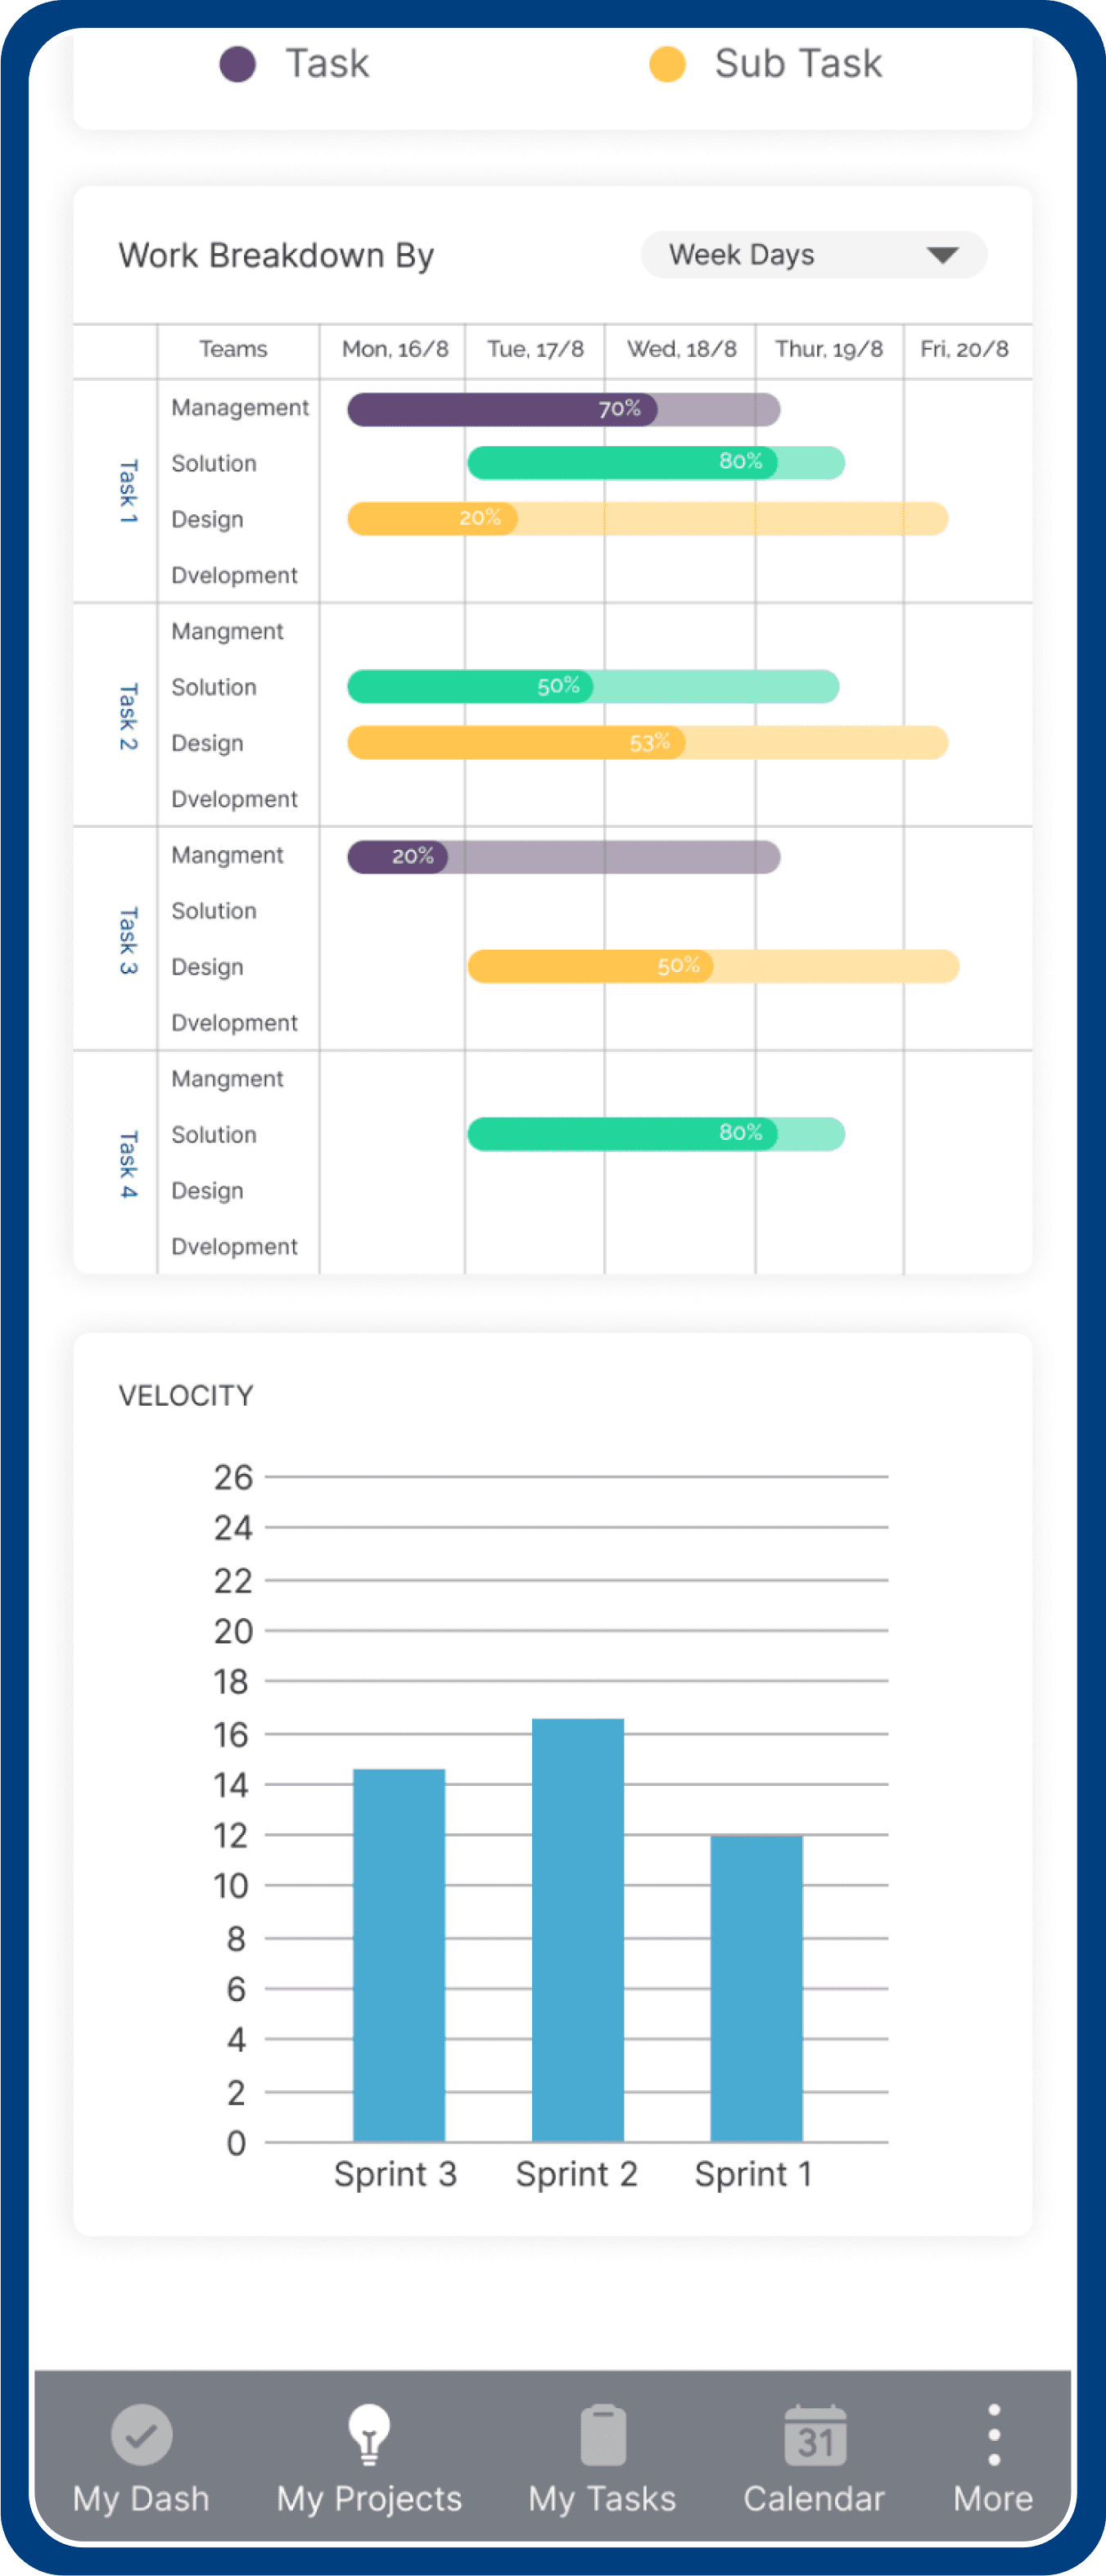
Once you have your teams, you can identify projects for each of them.
This is where you get the overview of the amount of bandwidth each team has, also other details like:
What the project is solving
What’s the status
When it’s shipping
Where to dive deeper into designs and decisions
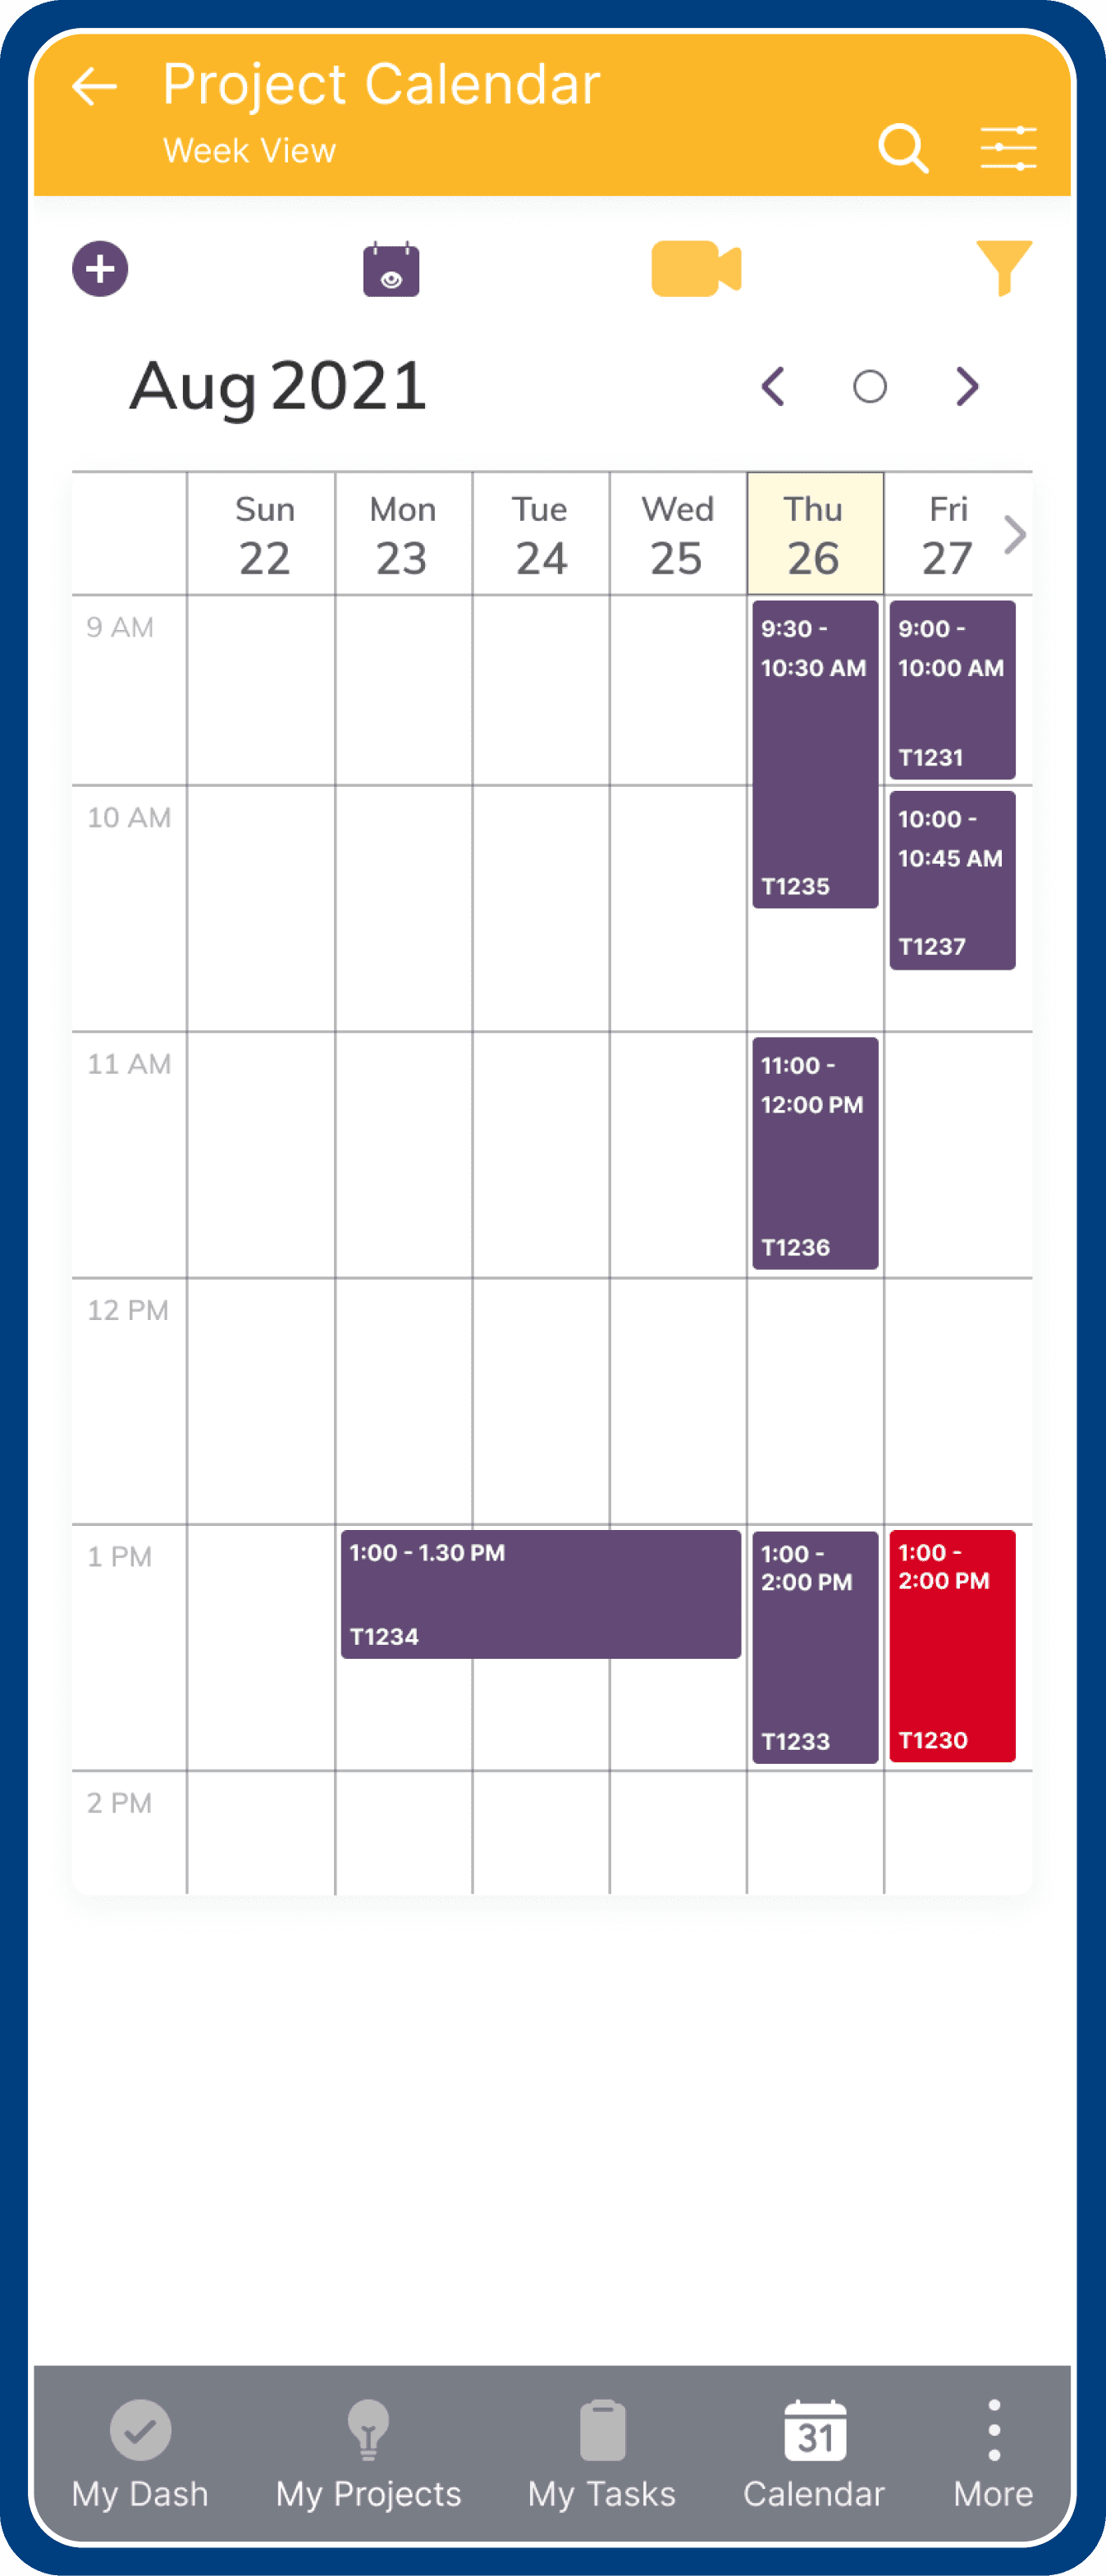
Calendar
The Principal: As a calendar we want users to have effective collaboration but also give back time to them. We want customers to navigate and scan the calendar surface quickly to consume and create calendar tasks according to their bandwidth. The entire visual design is based on these principles of quick consumption and the creation of calendar tasks.
Architecture: In terms of architecture calendar have 2 components, action bar, Power bar (Fixed to top), and then comes the canvas. Everything that is inside the apps is present in apps control, in simple terms all the apps load inside the canvas.
Action Bar: The action bar consists of actions that can be taken in the calendar surface as create task, navigation between different views, create meeting, and view picker.
A) Default Month View
B) Selecting view type
Layout View
Calendar lets user create task, meetings and helps efficient management of time. It helps users to see tasks of a particular day, week or a month range.
Filter Action Item allows user to view & select different calendar view.
Currently, for a new user, we default the view to month view. According to the preference and the density of the tasks, user can choose to have different surfaces, the 3 type of view are:
Floating Date: This is a default view, it shows all tasks in current or selected month.
Range - Start to End: shows task scheduled in week format.
Timeline: Also shown work scheduled in week format added with tasks lifespan in a week.
Layout View Types
Floating Date
Range
Timeline
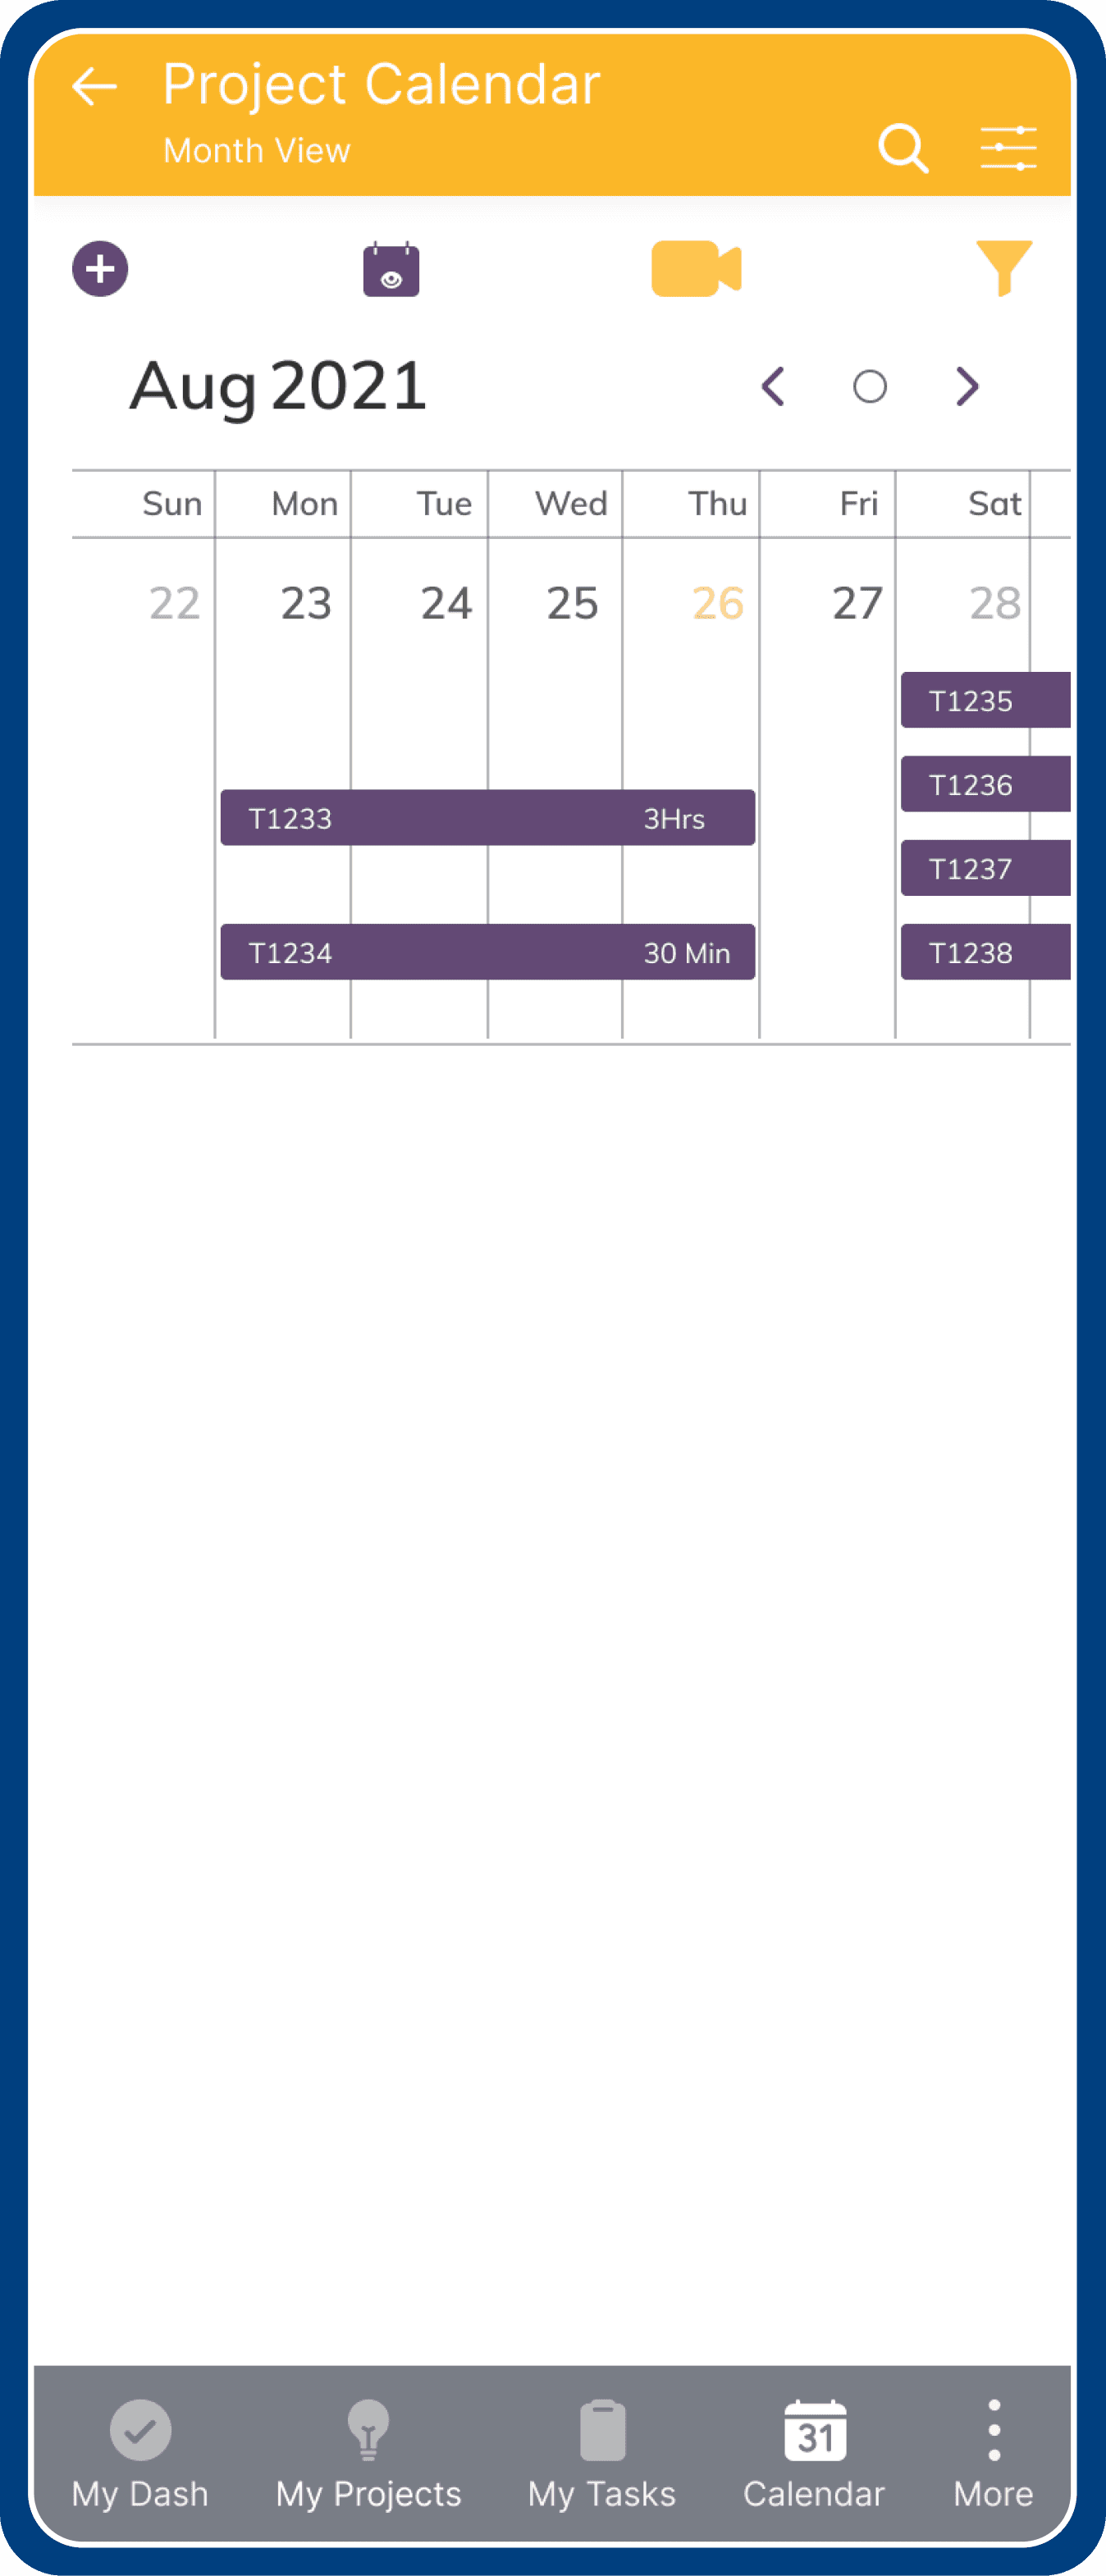
Surface
According to the preference and the density of the tasks, user can choose to have different surfaces, the 3 type of view:
Floating Date
This is a default view, it shows all tasks in current or selected month.
Range - Start to End
Shows task scheduled in week format.
Timeline
Also shown work scheduled in week format added with tasks lifespan in a week.
Calendar Month Layout View Types
Current Month
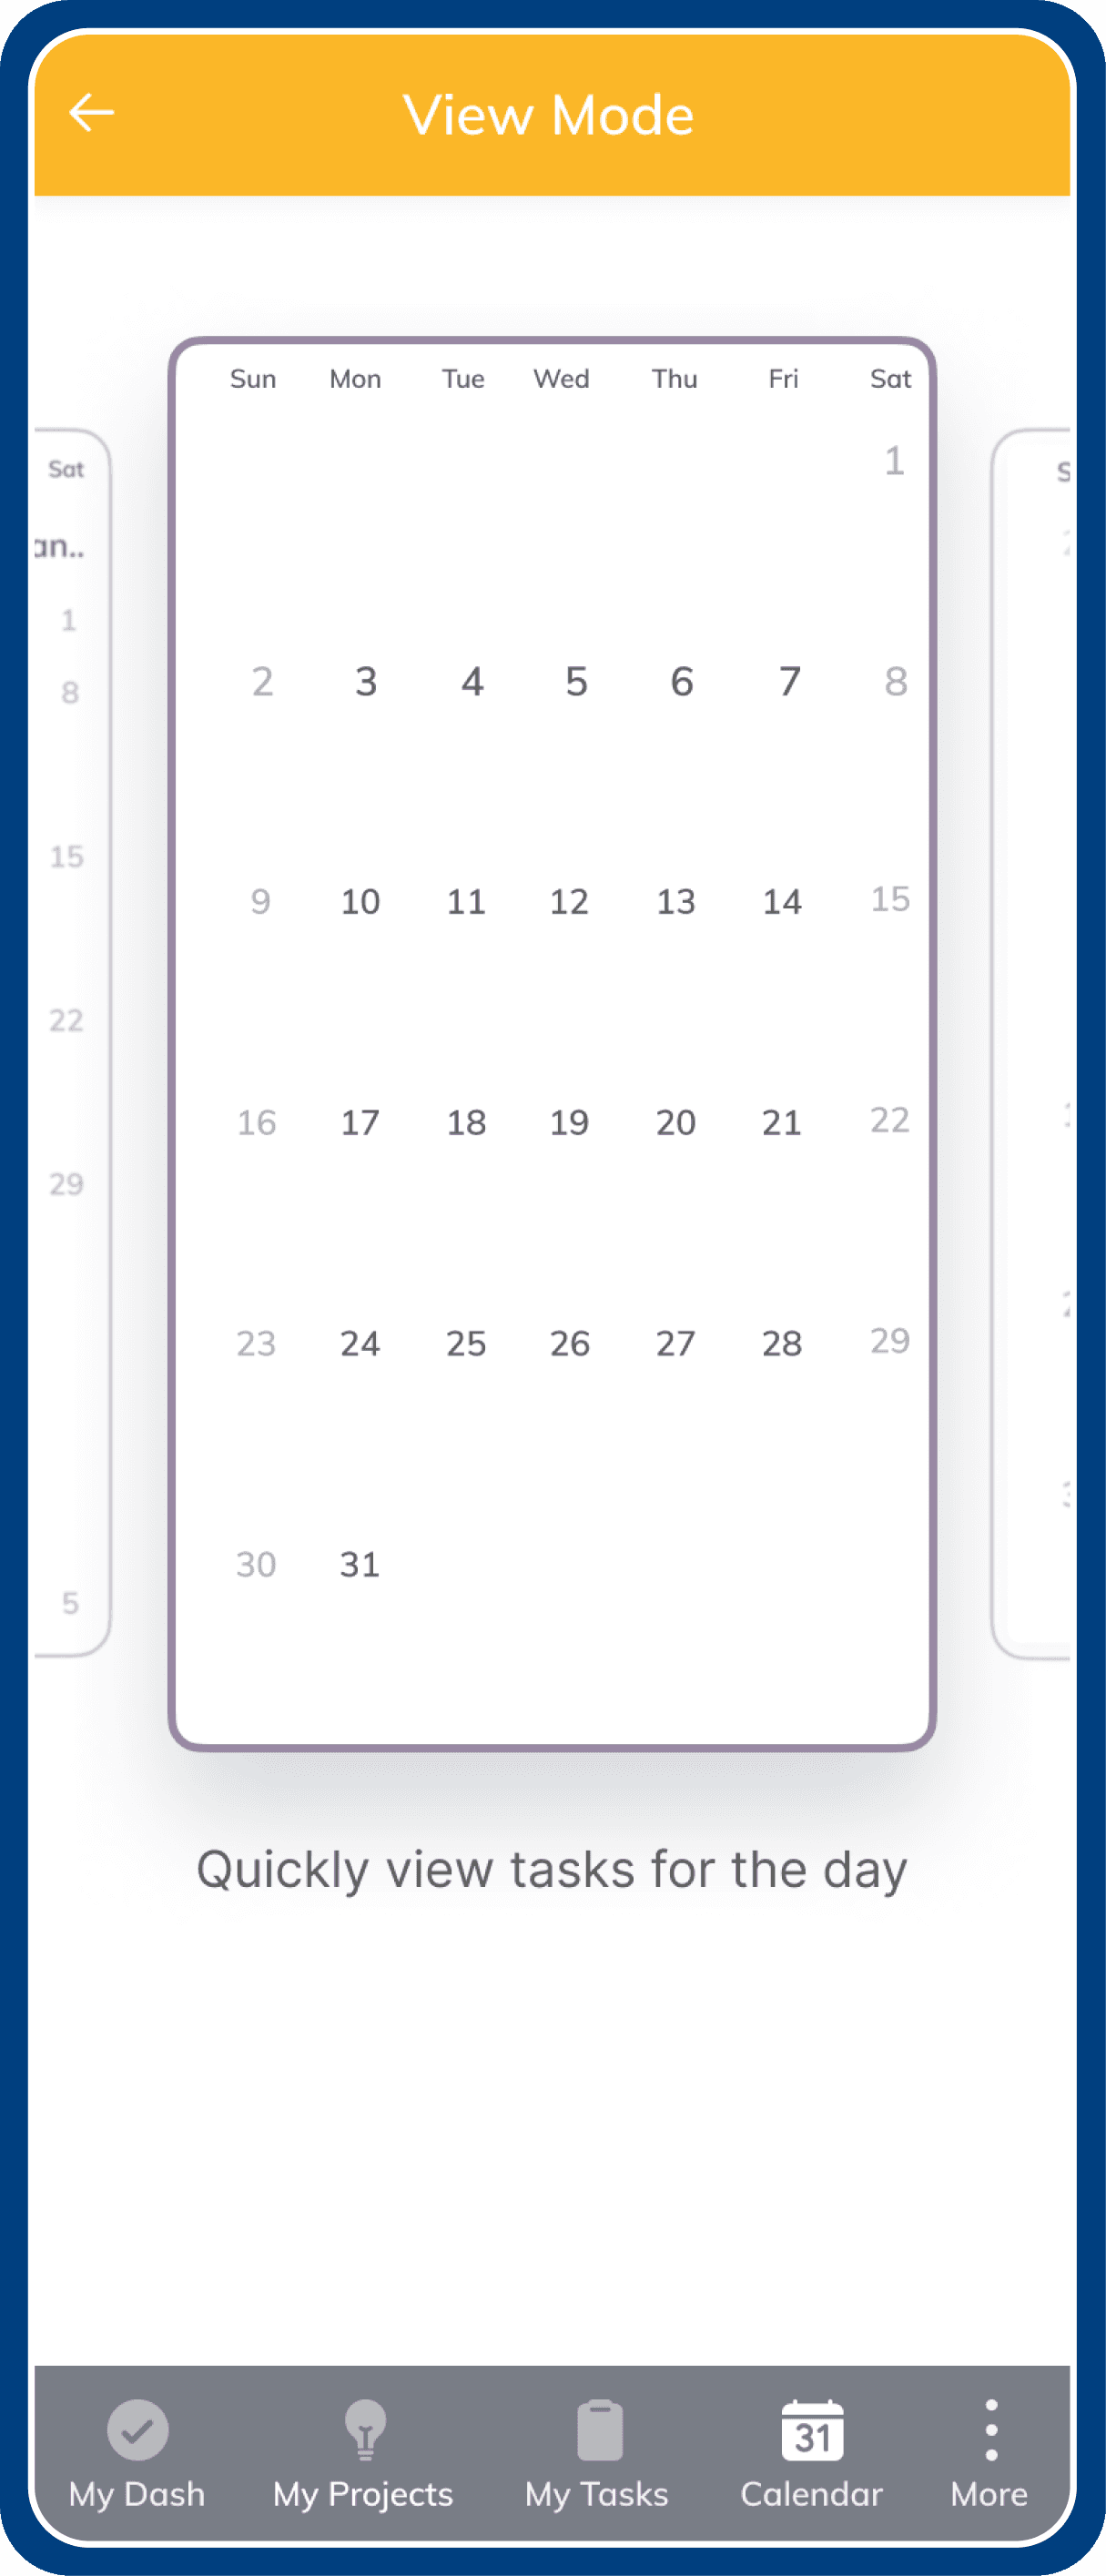
Following Months
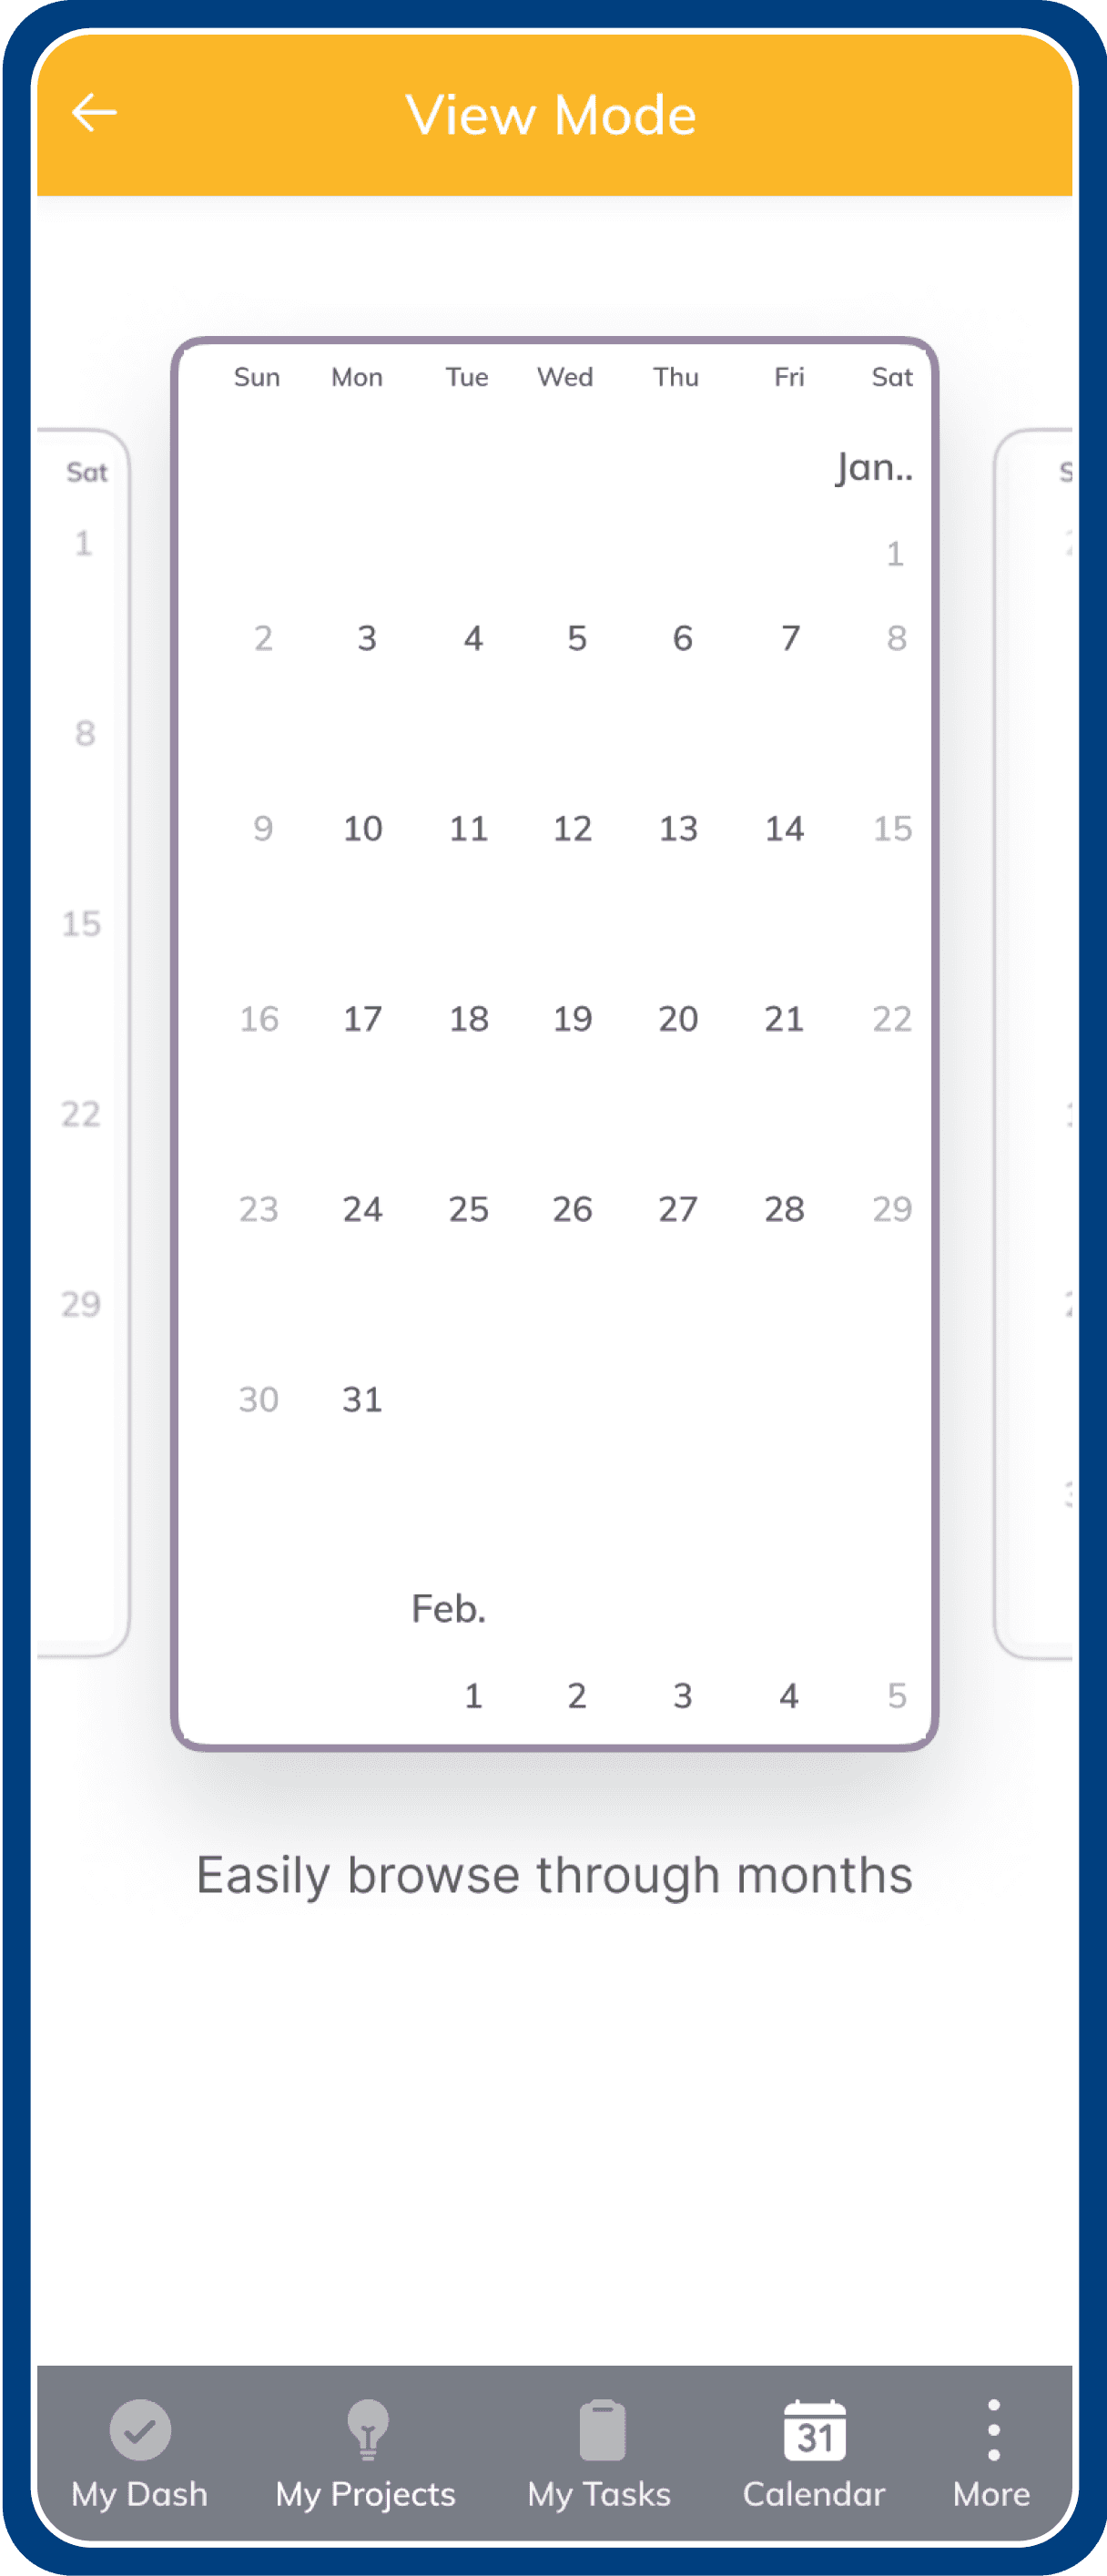
Months with past & next dates
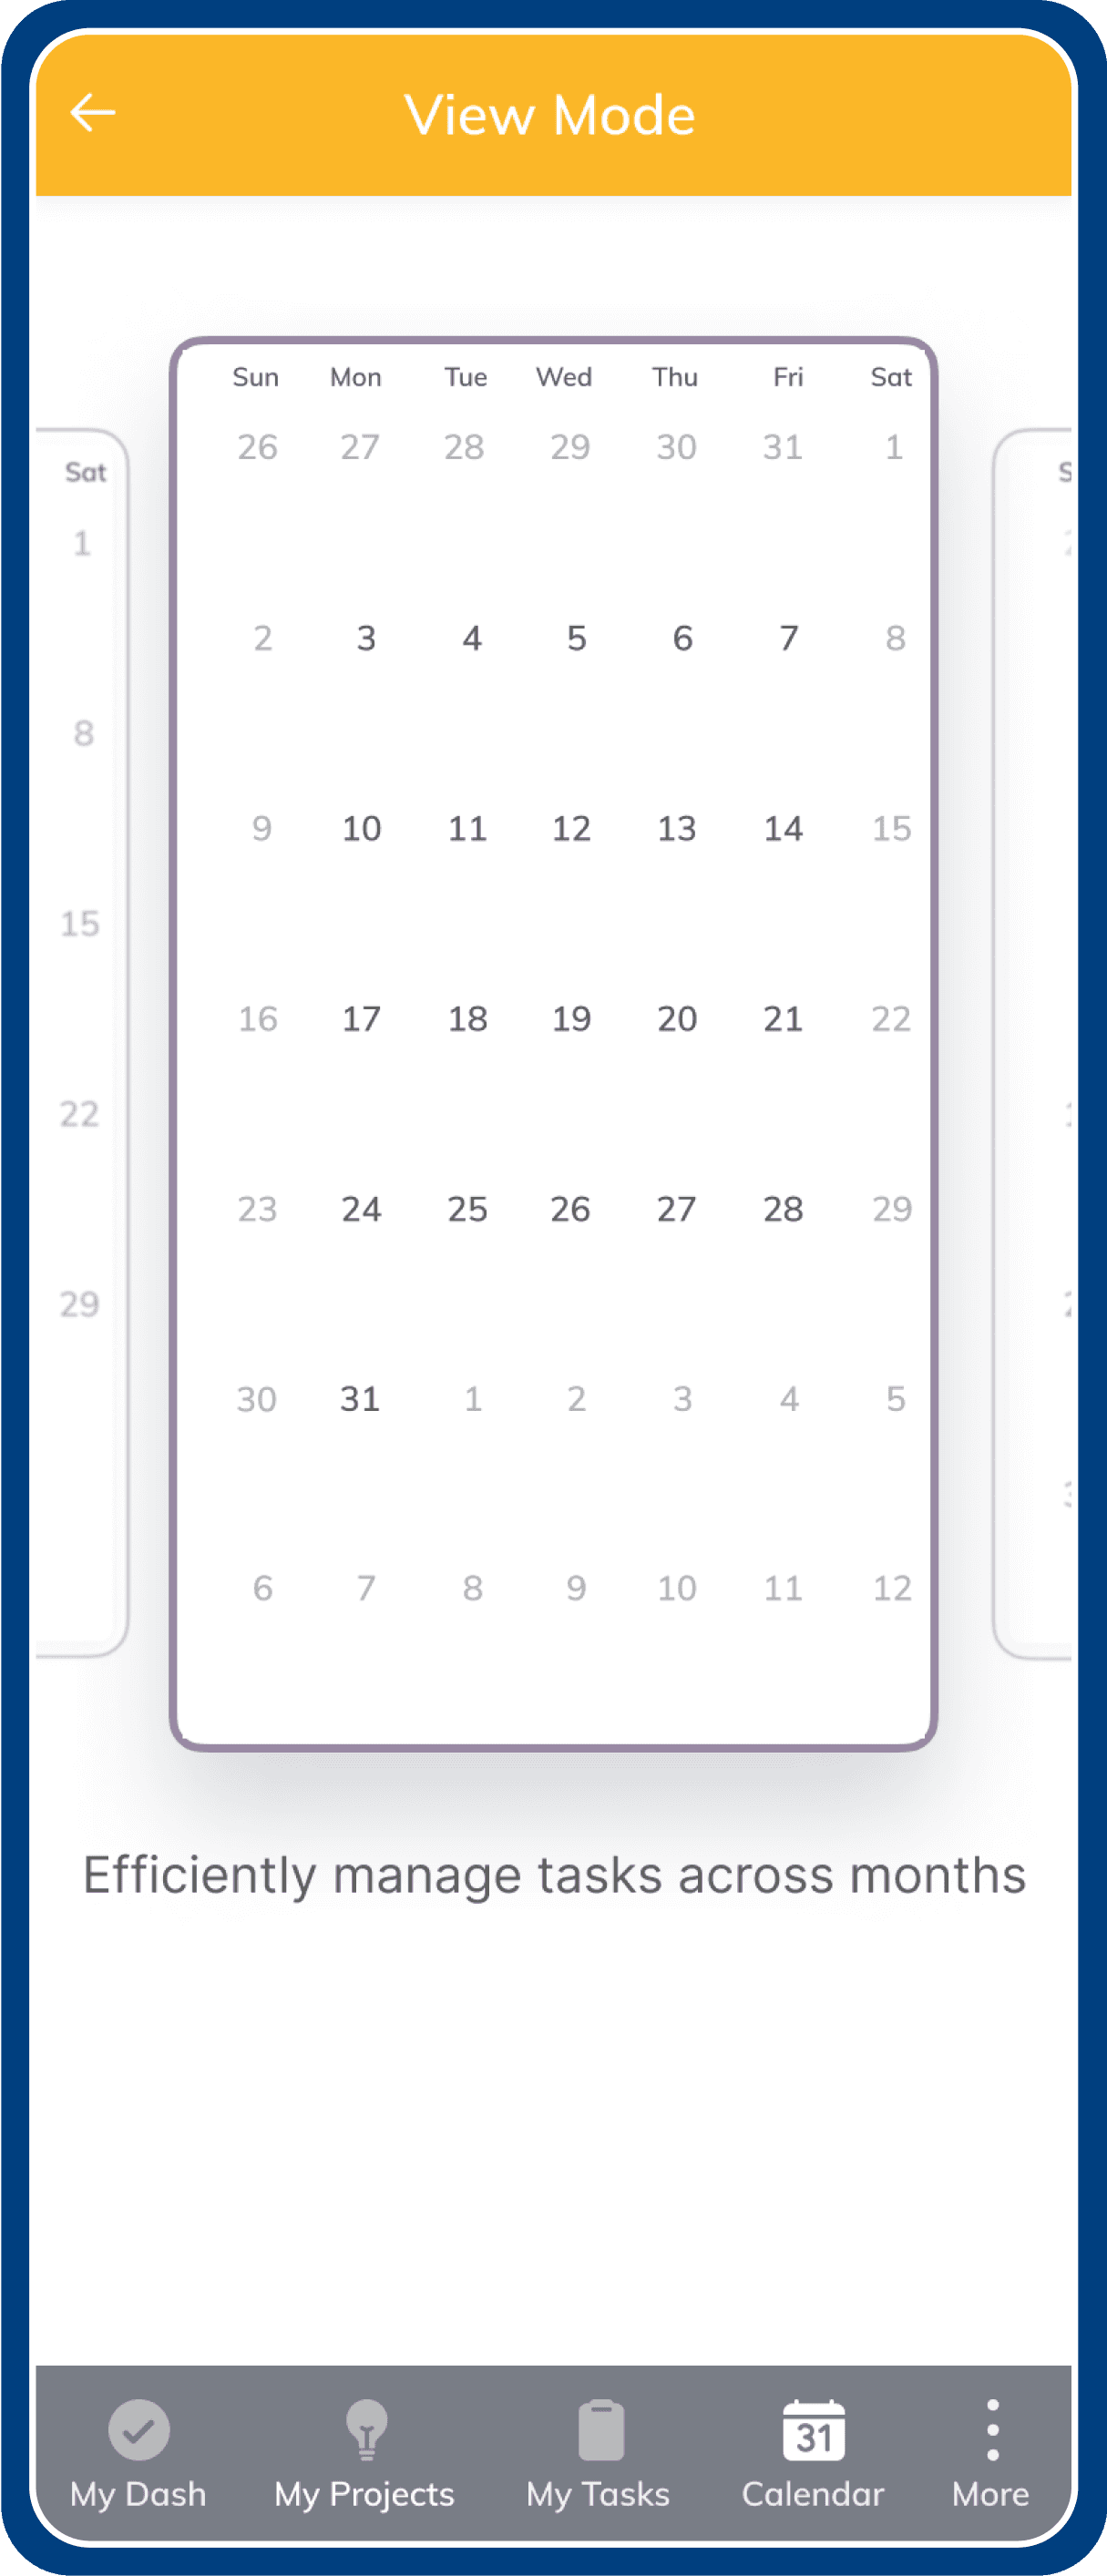
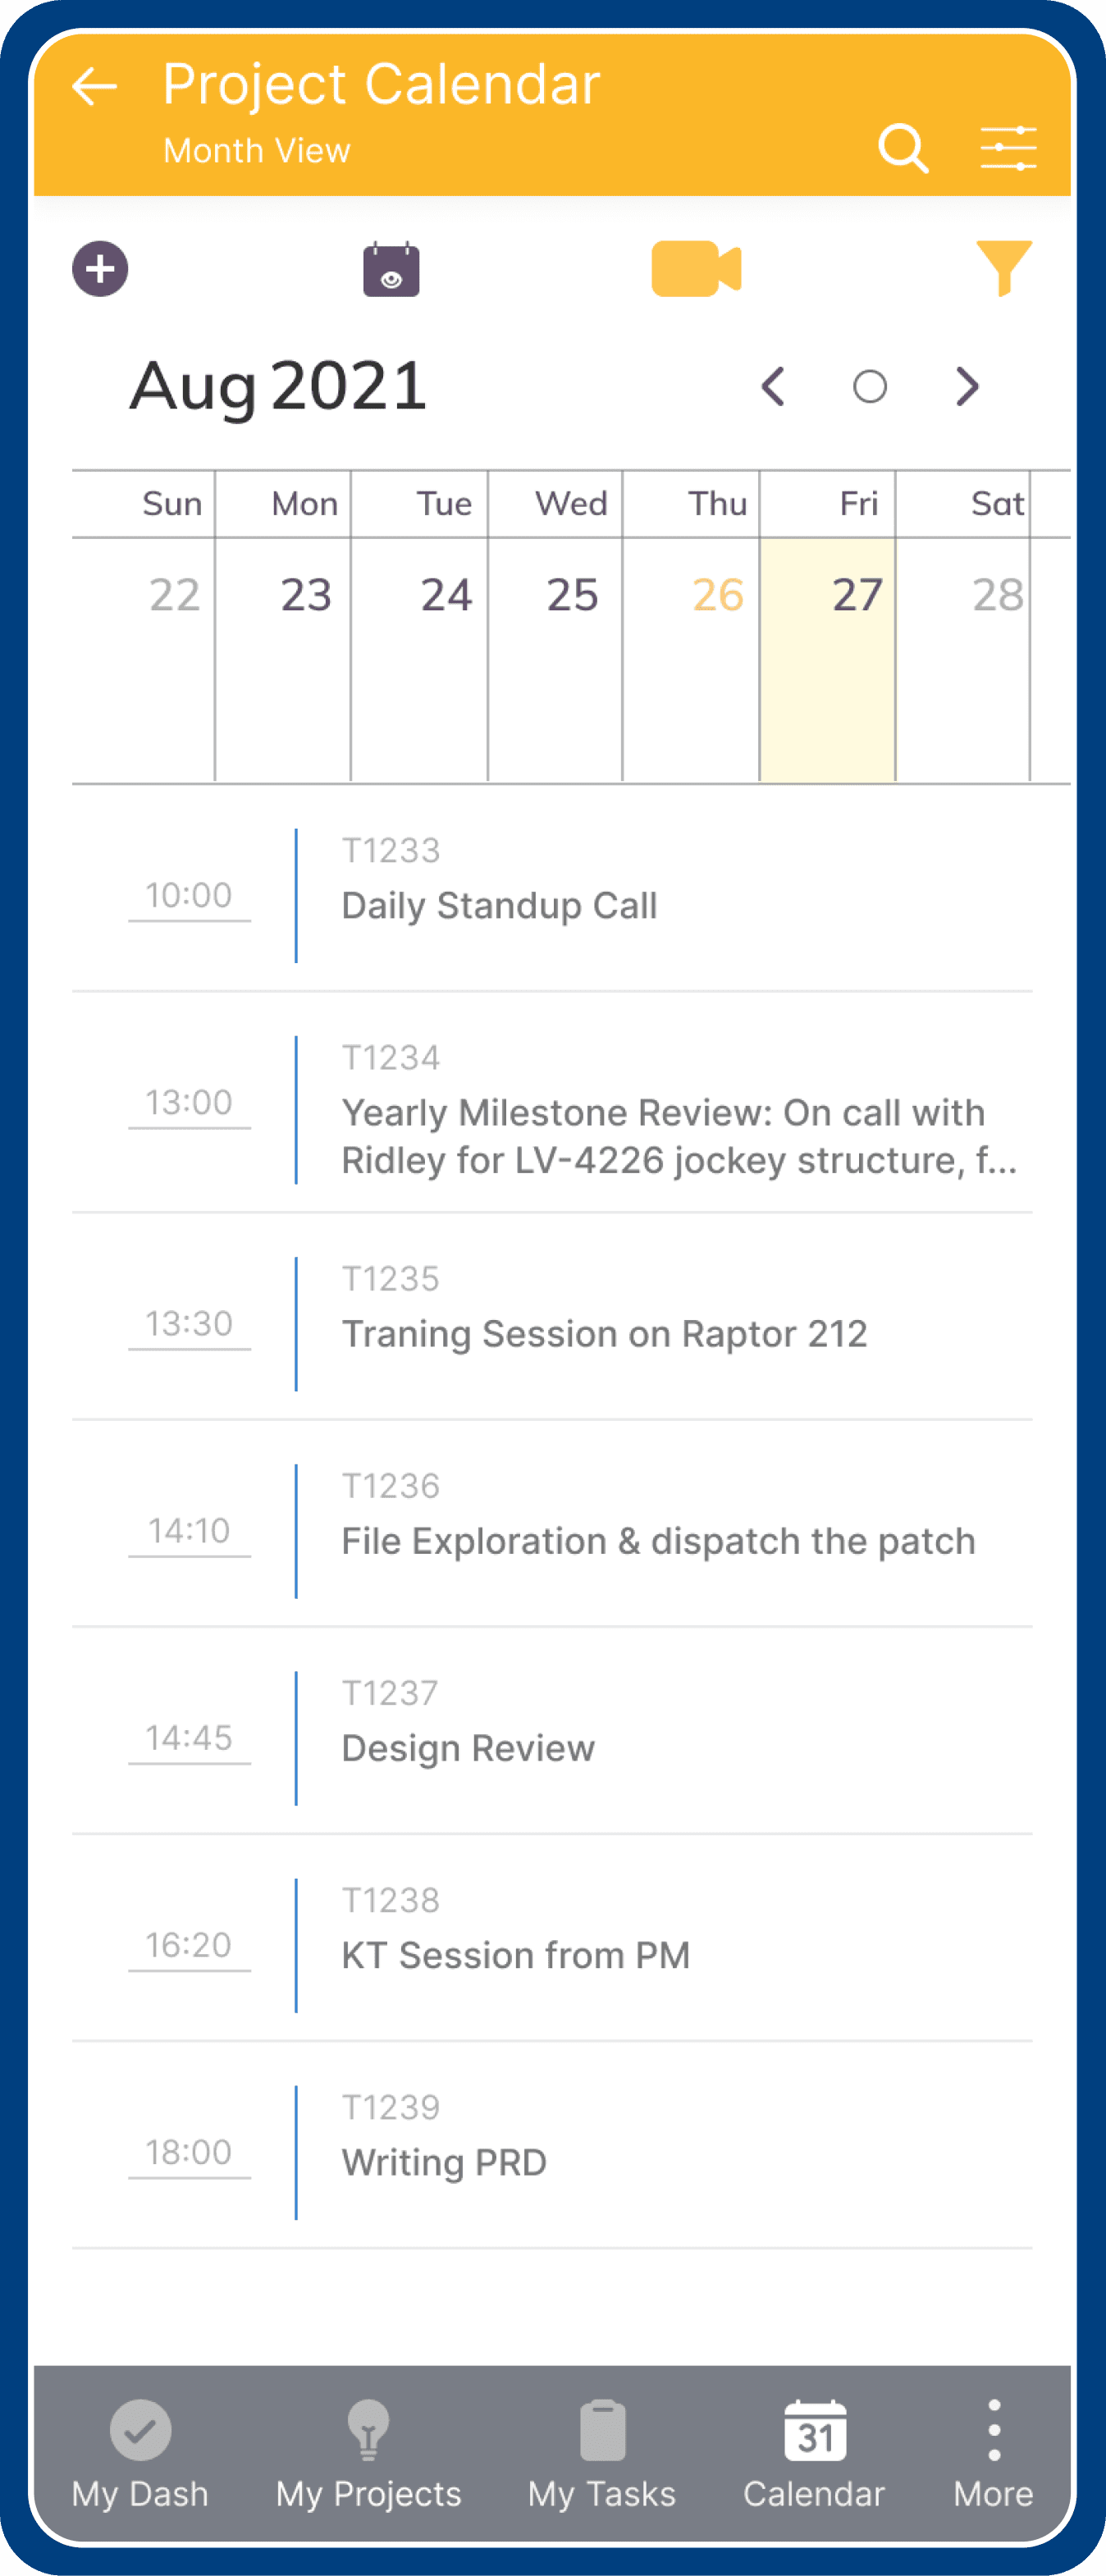
Month View
The surface is where the user will be able to grab a quick view of their entire calendar.
There are multiple views of the calendar surface
(Task of day, Task through a month & Task across the months).
According to the preference and the density of the events, customers might choose to have different surfaces.
Currently, for a new user, we default the view to Task of day.
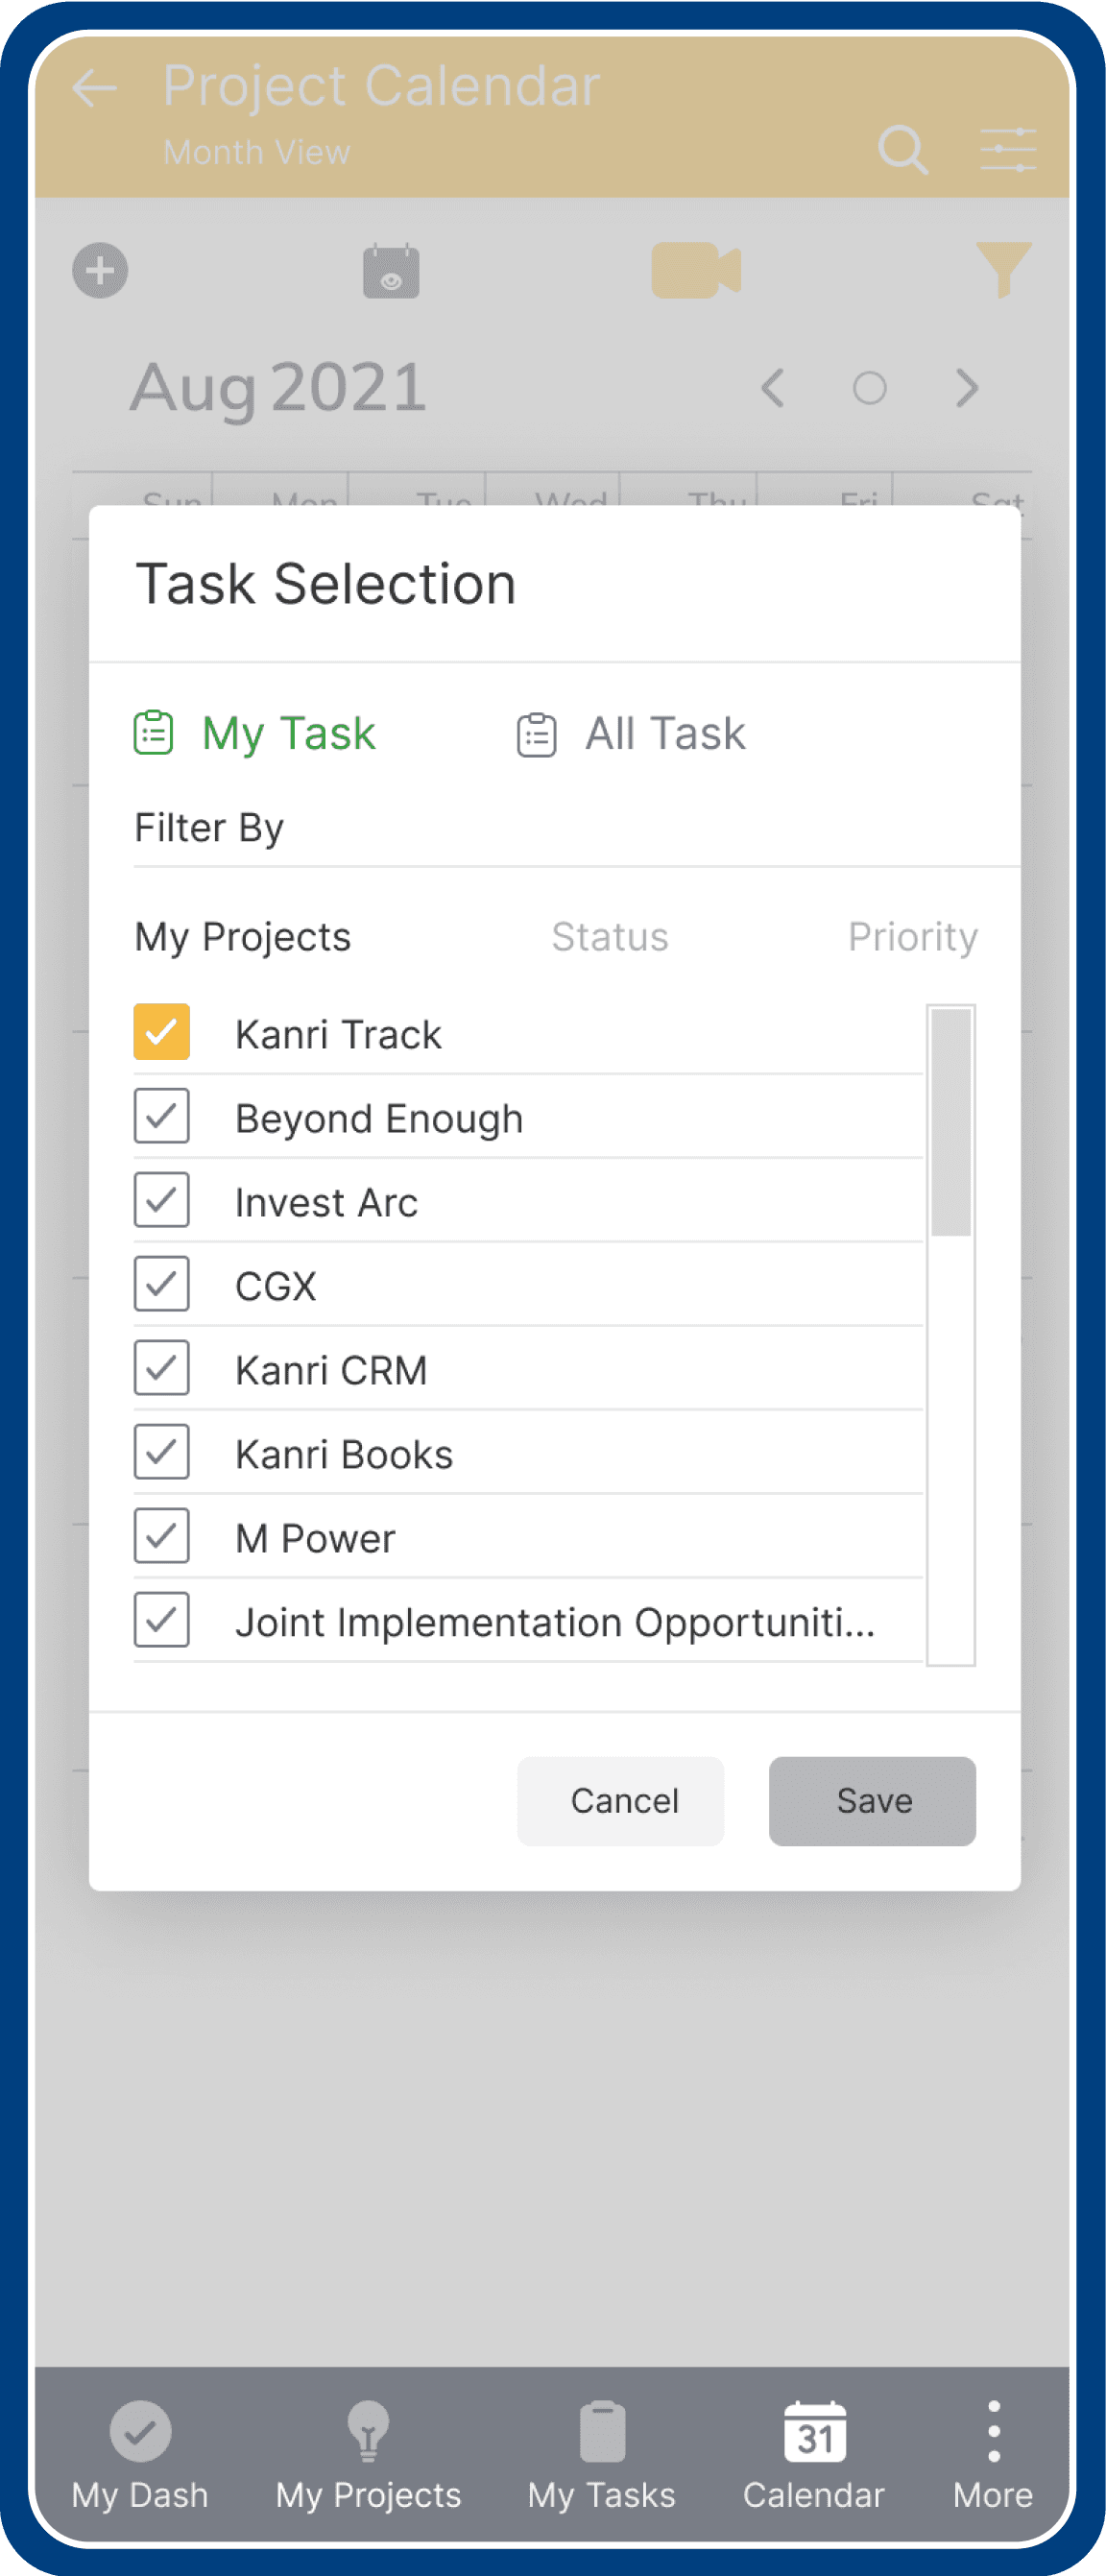
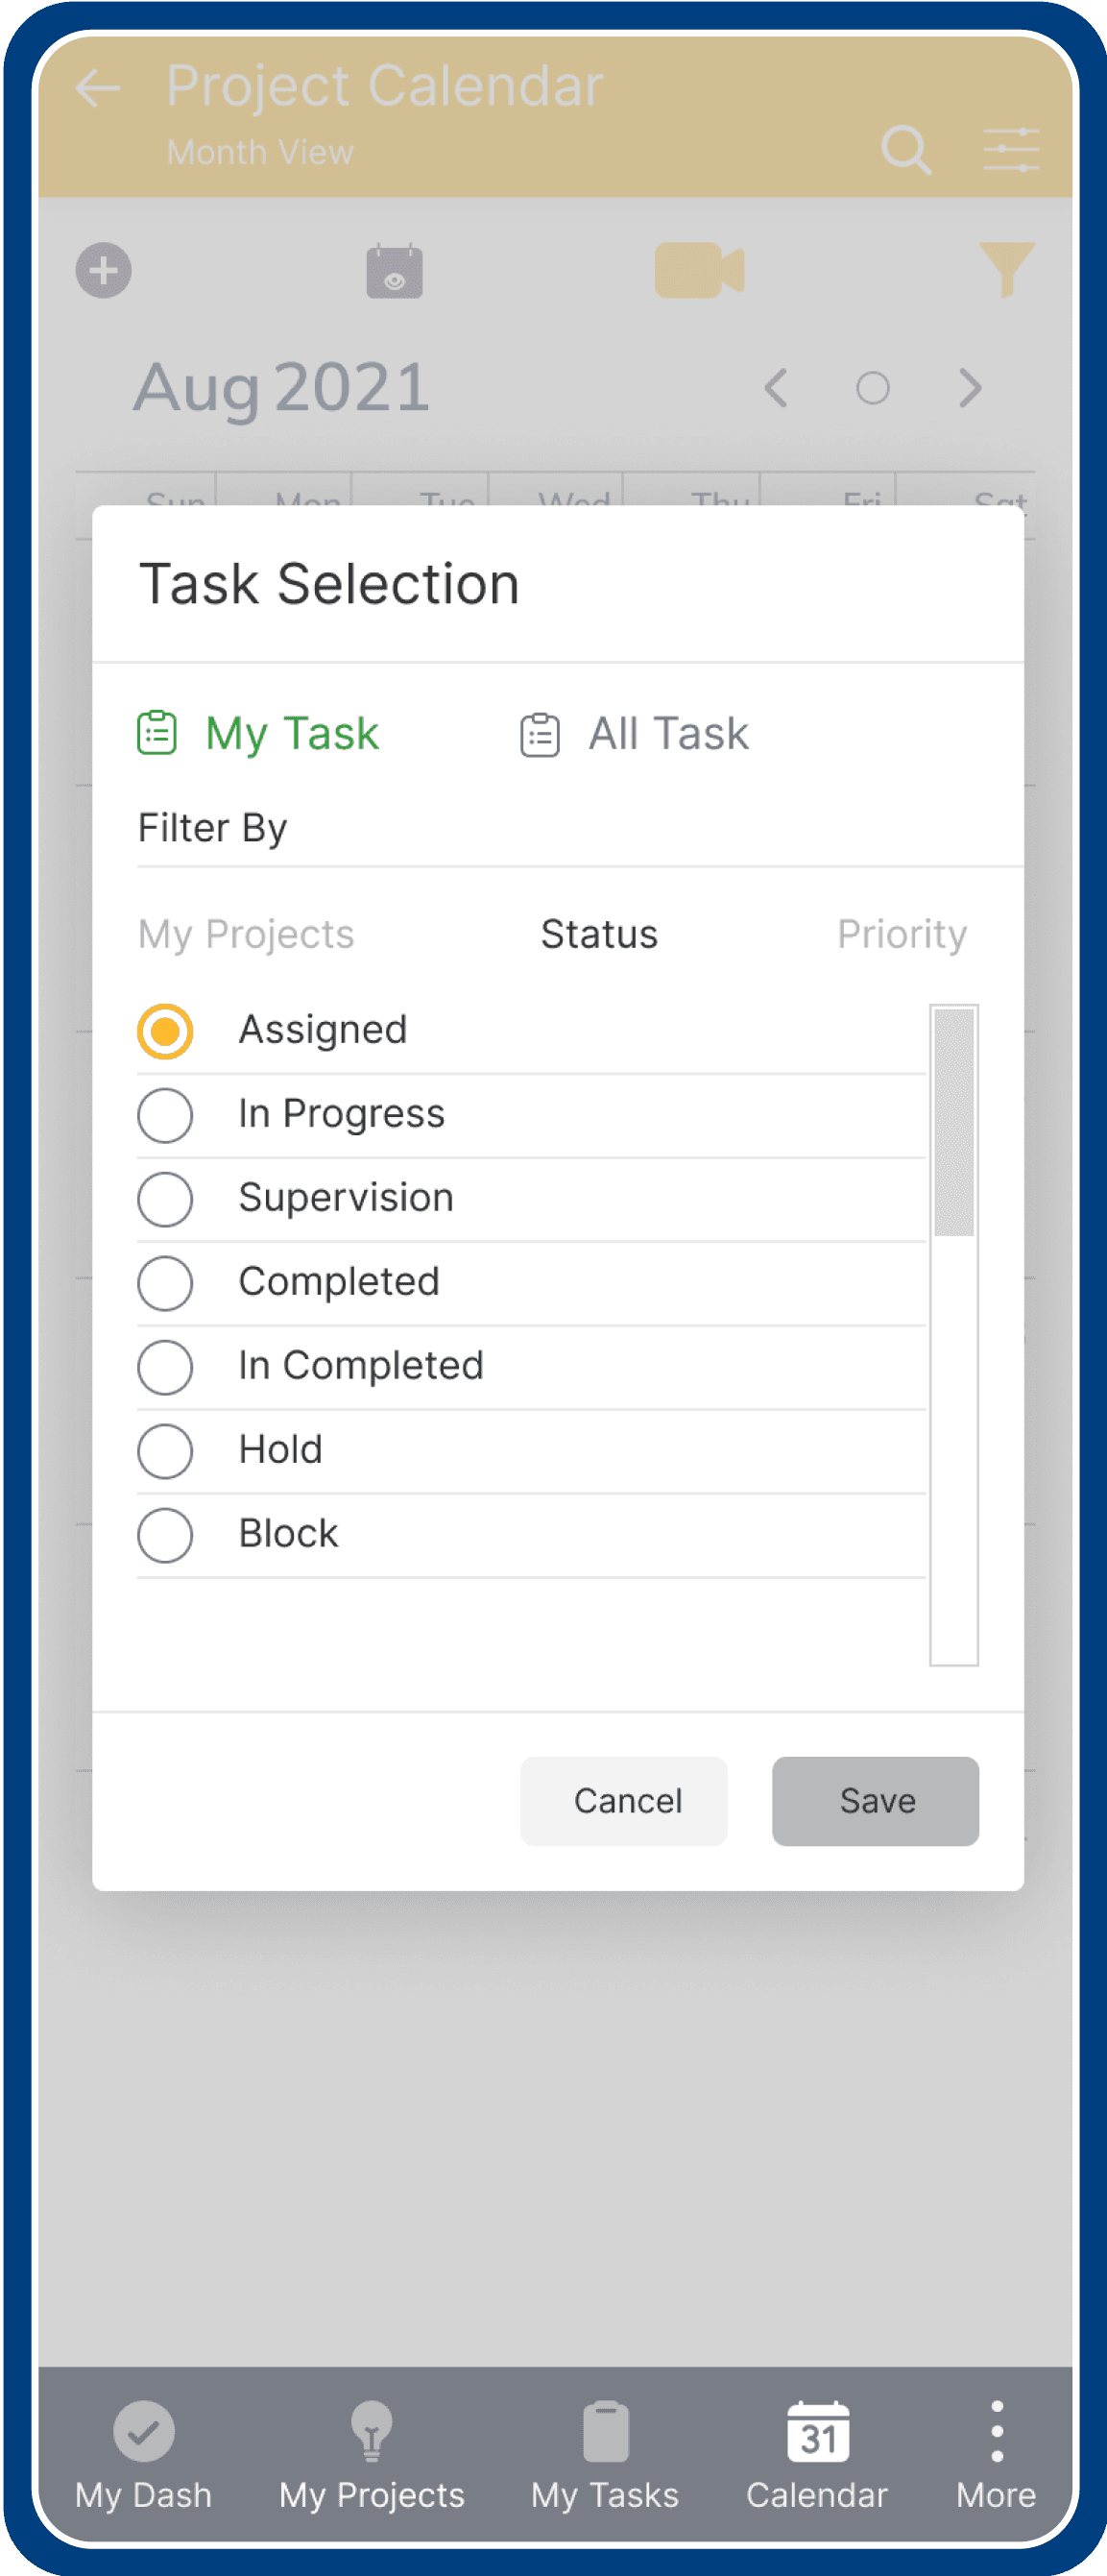
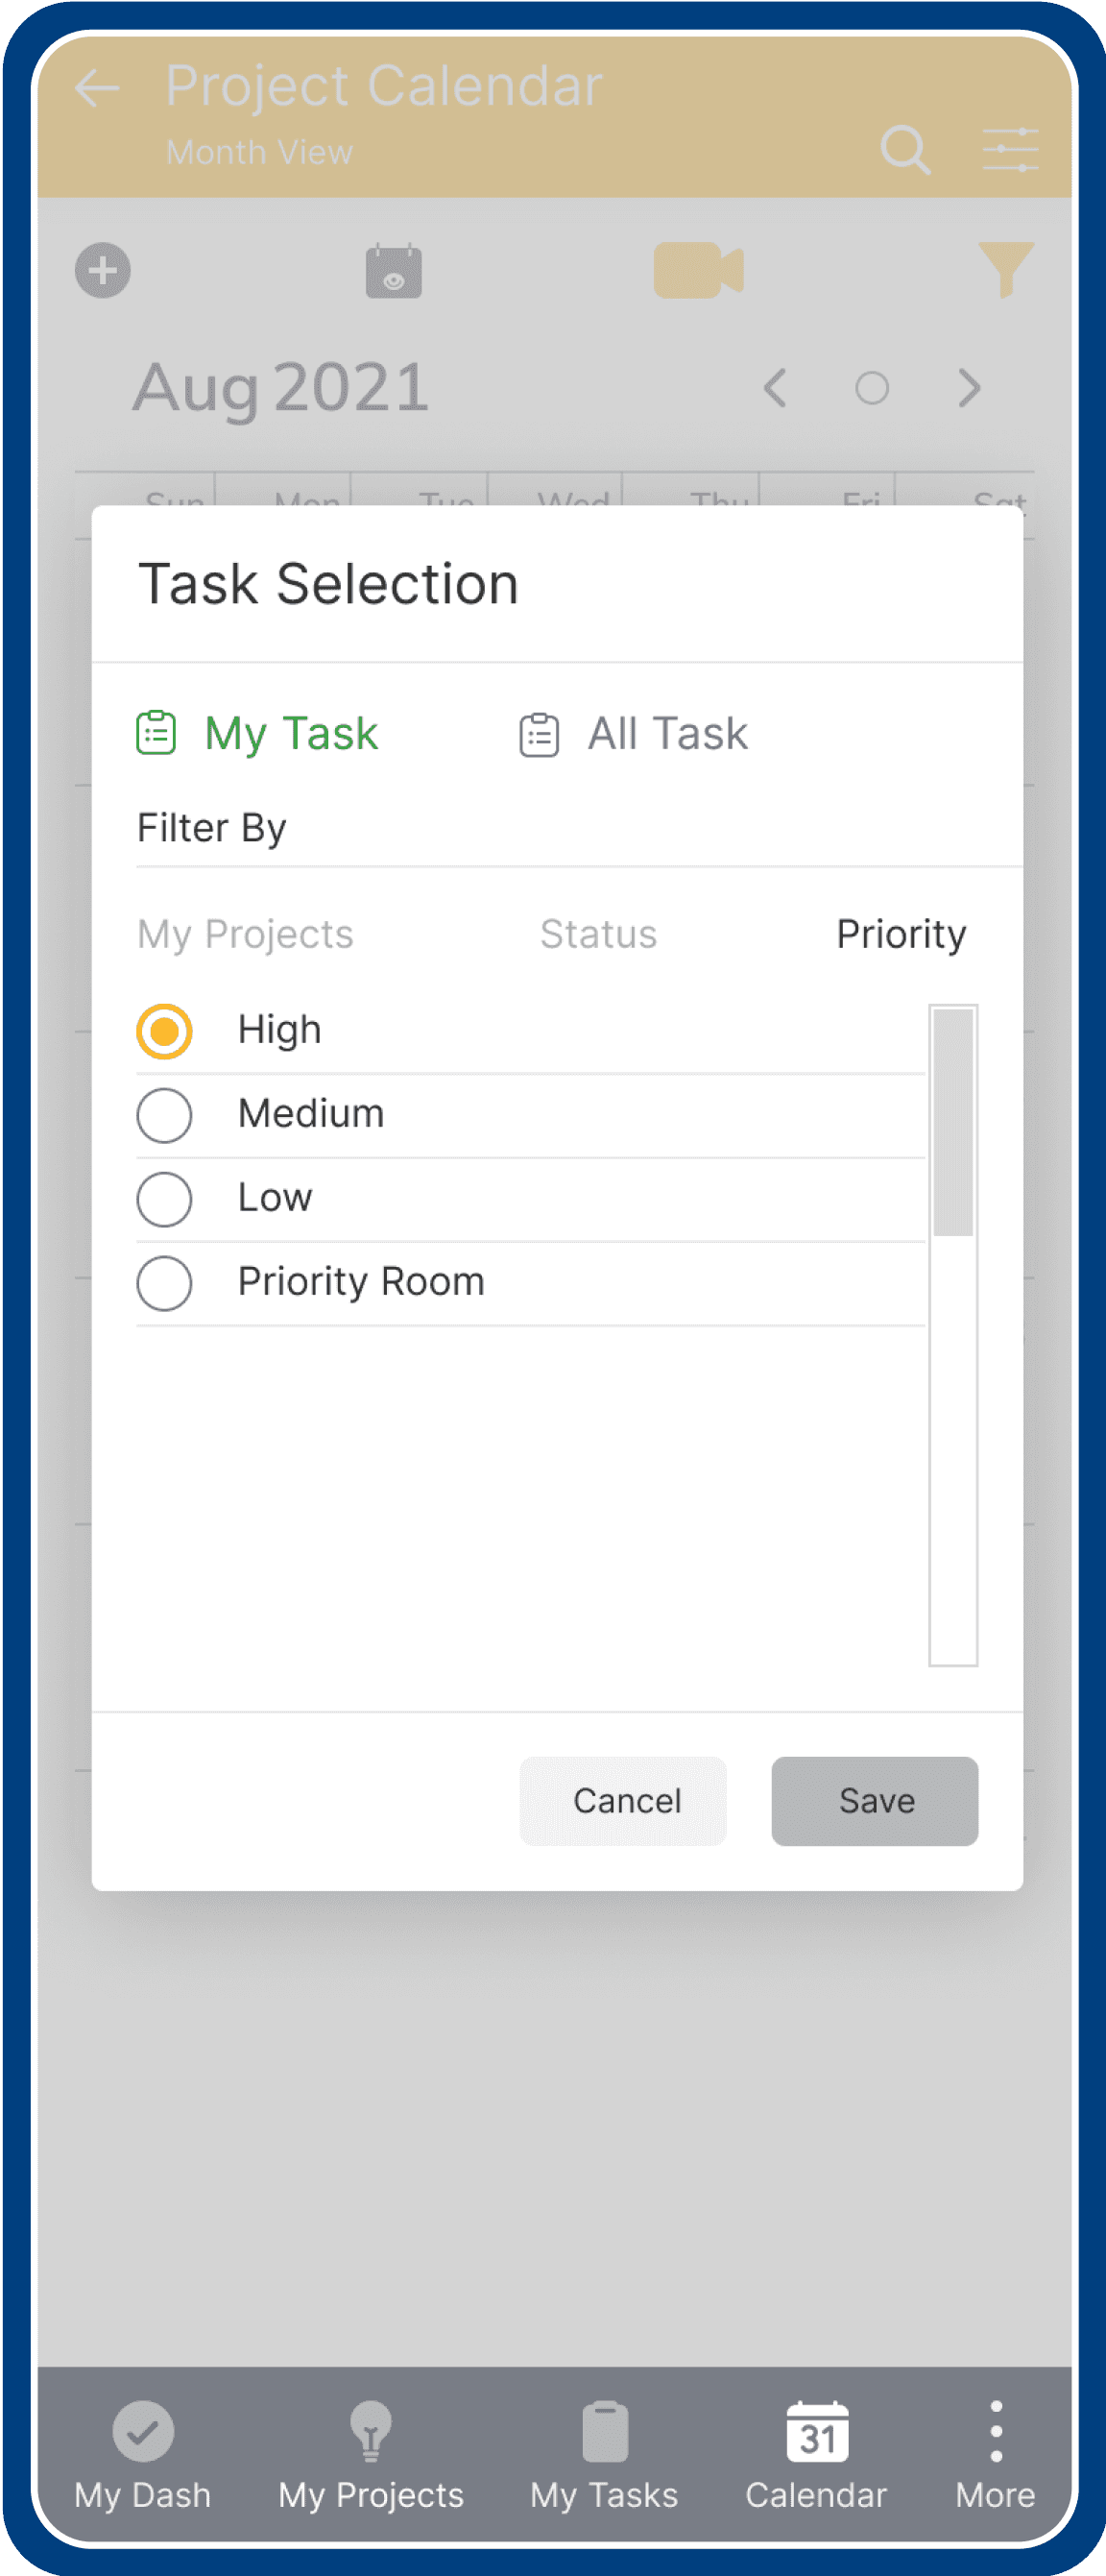
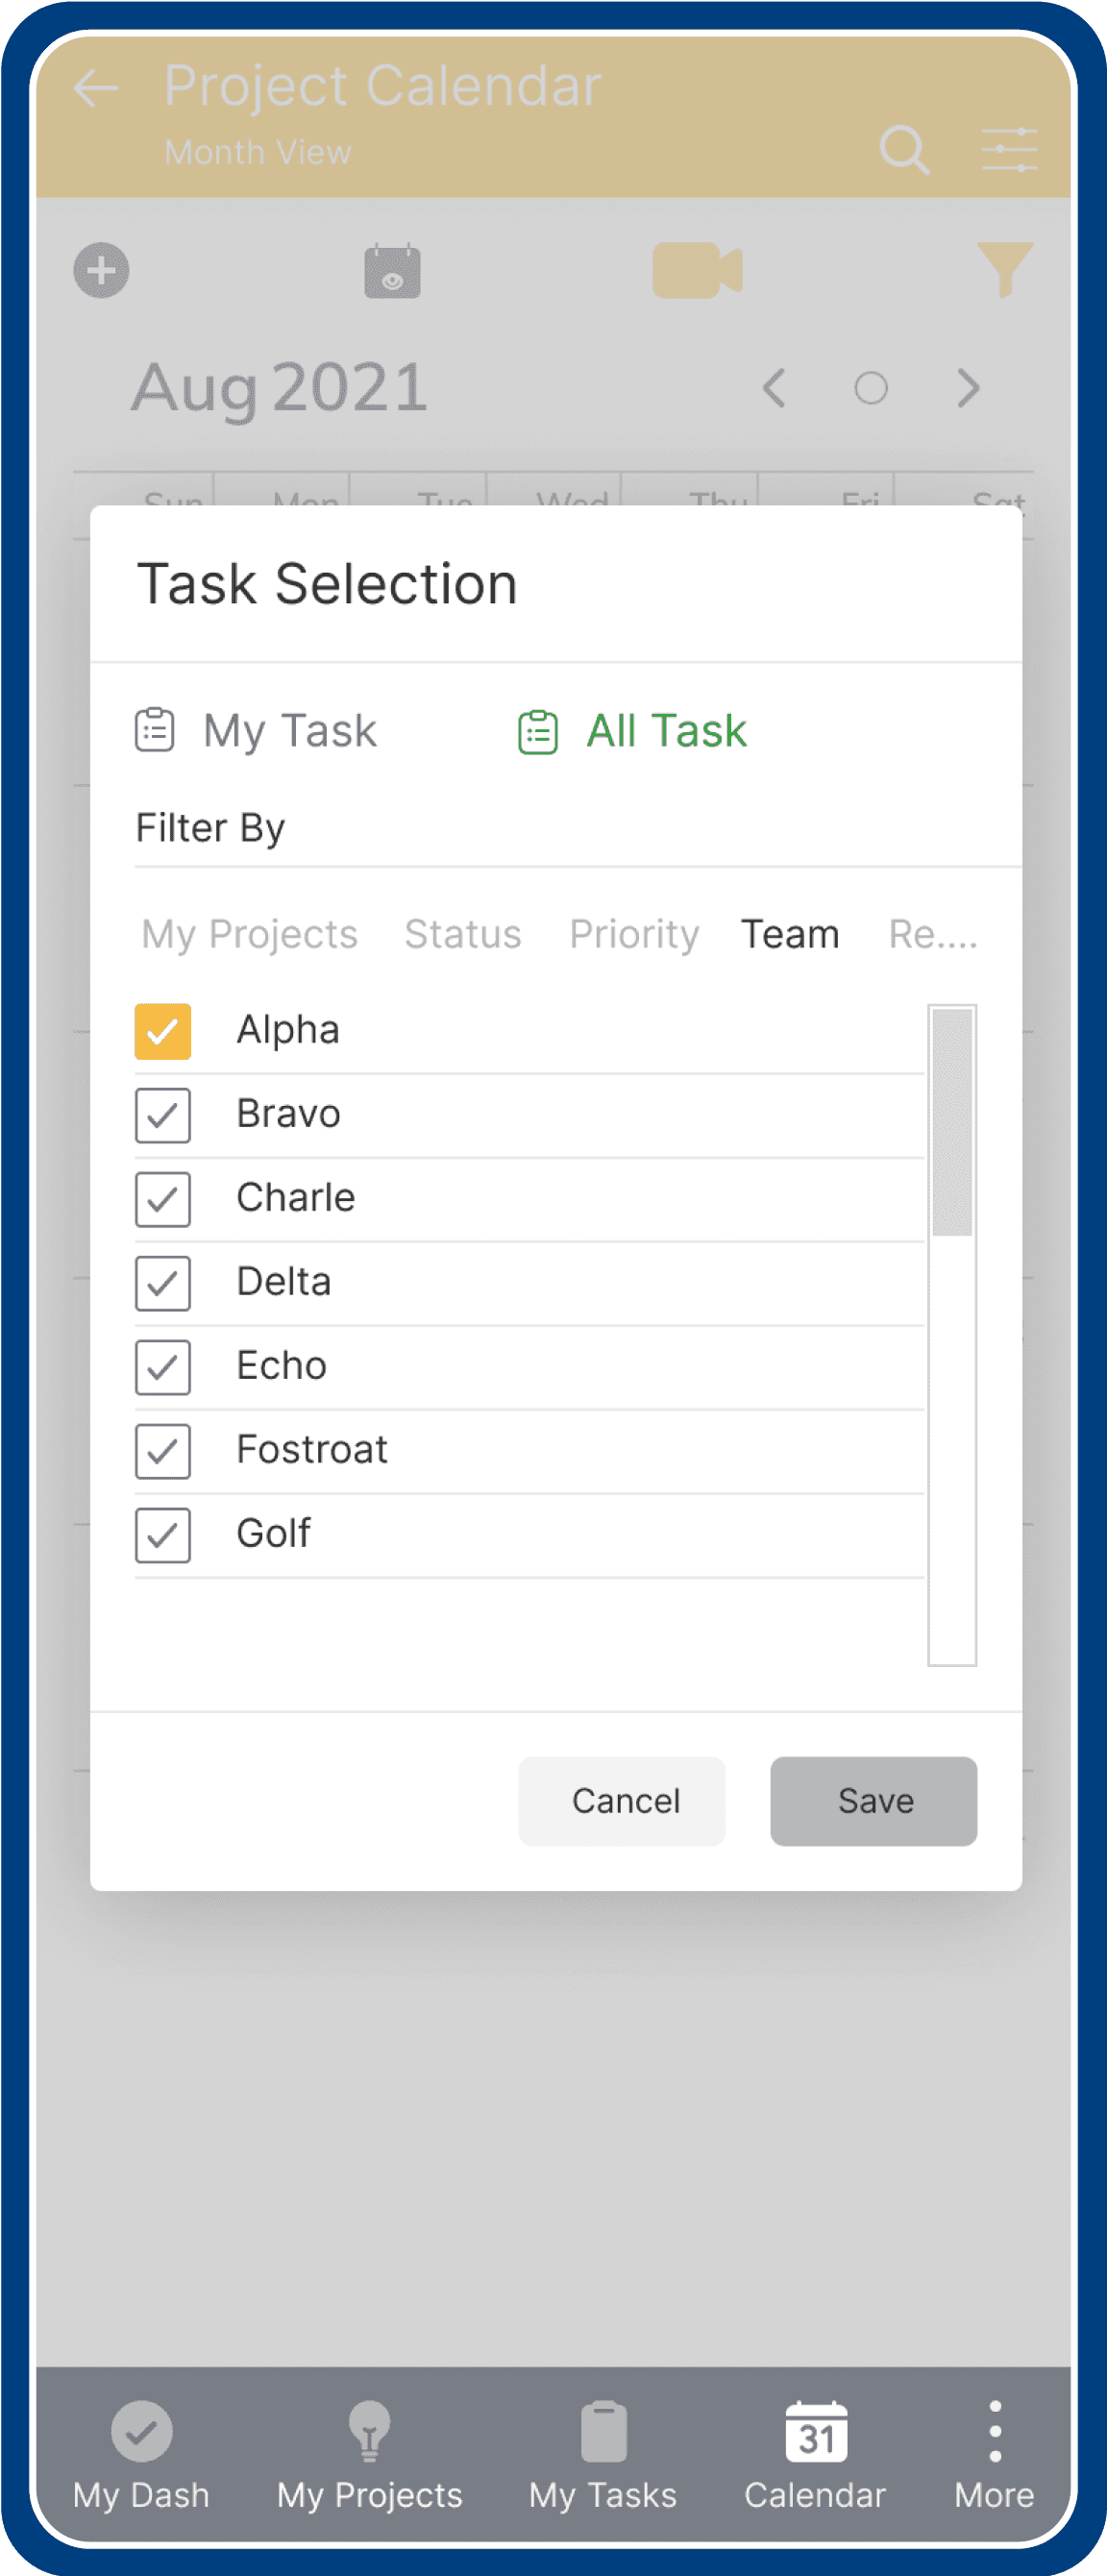
Selecting Task Types
User can filter tasks from My & All tasks that consisite of varity of categories based on projects, status, team type & priority.
a) My Task - Projects
My Task - Status
My Task - Priority
All Task - Projects
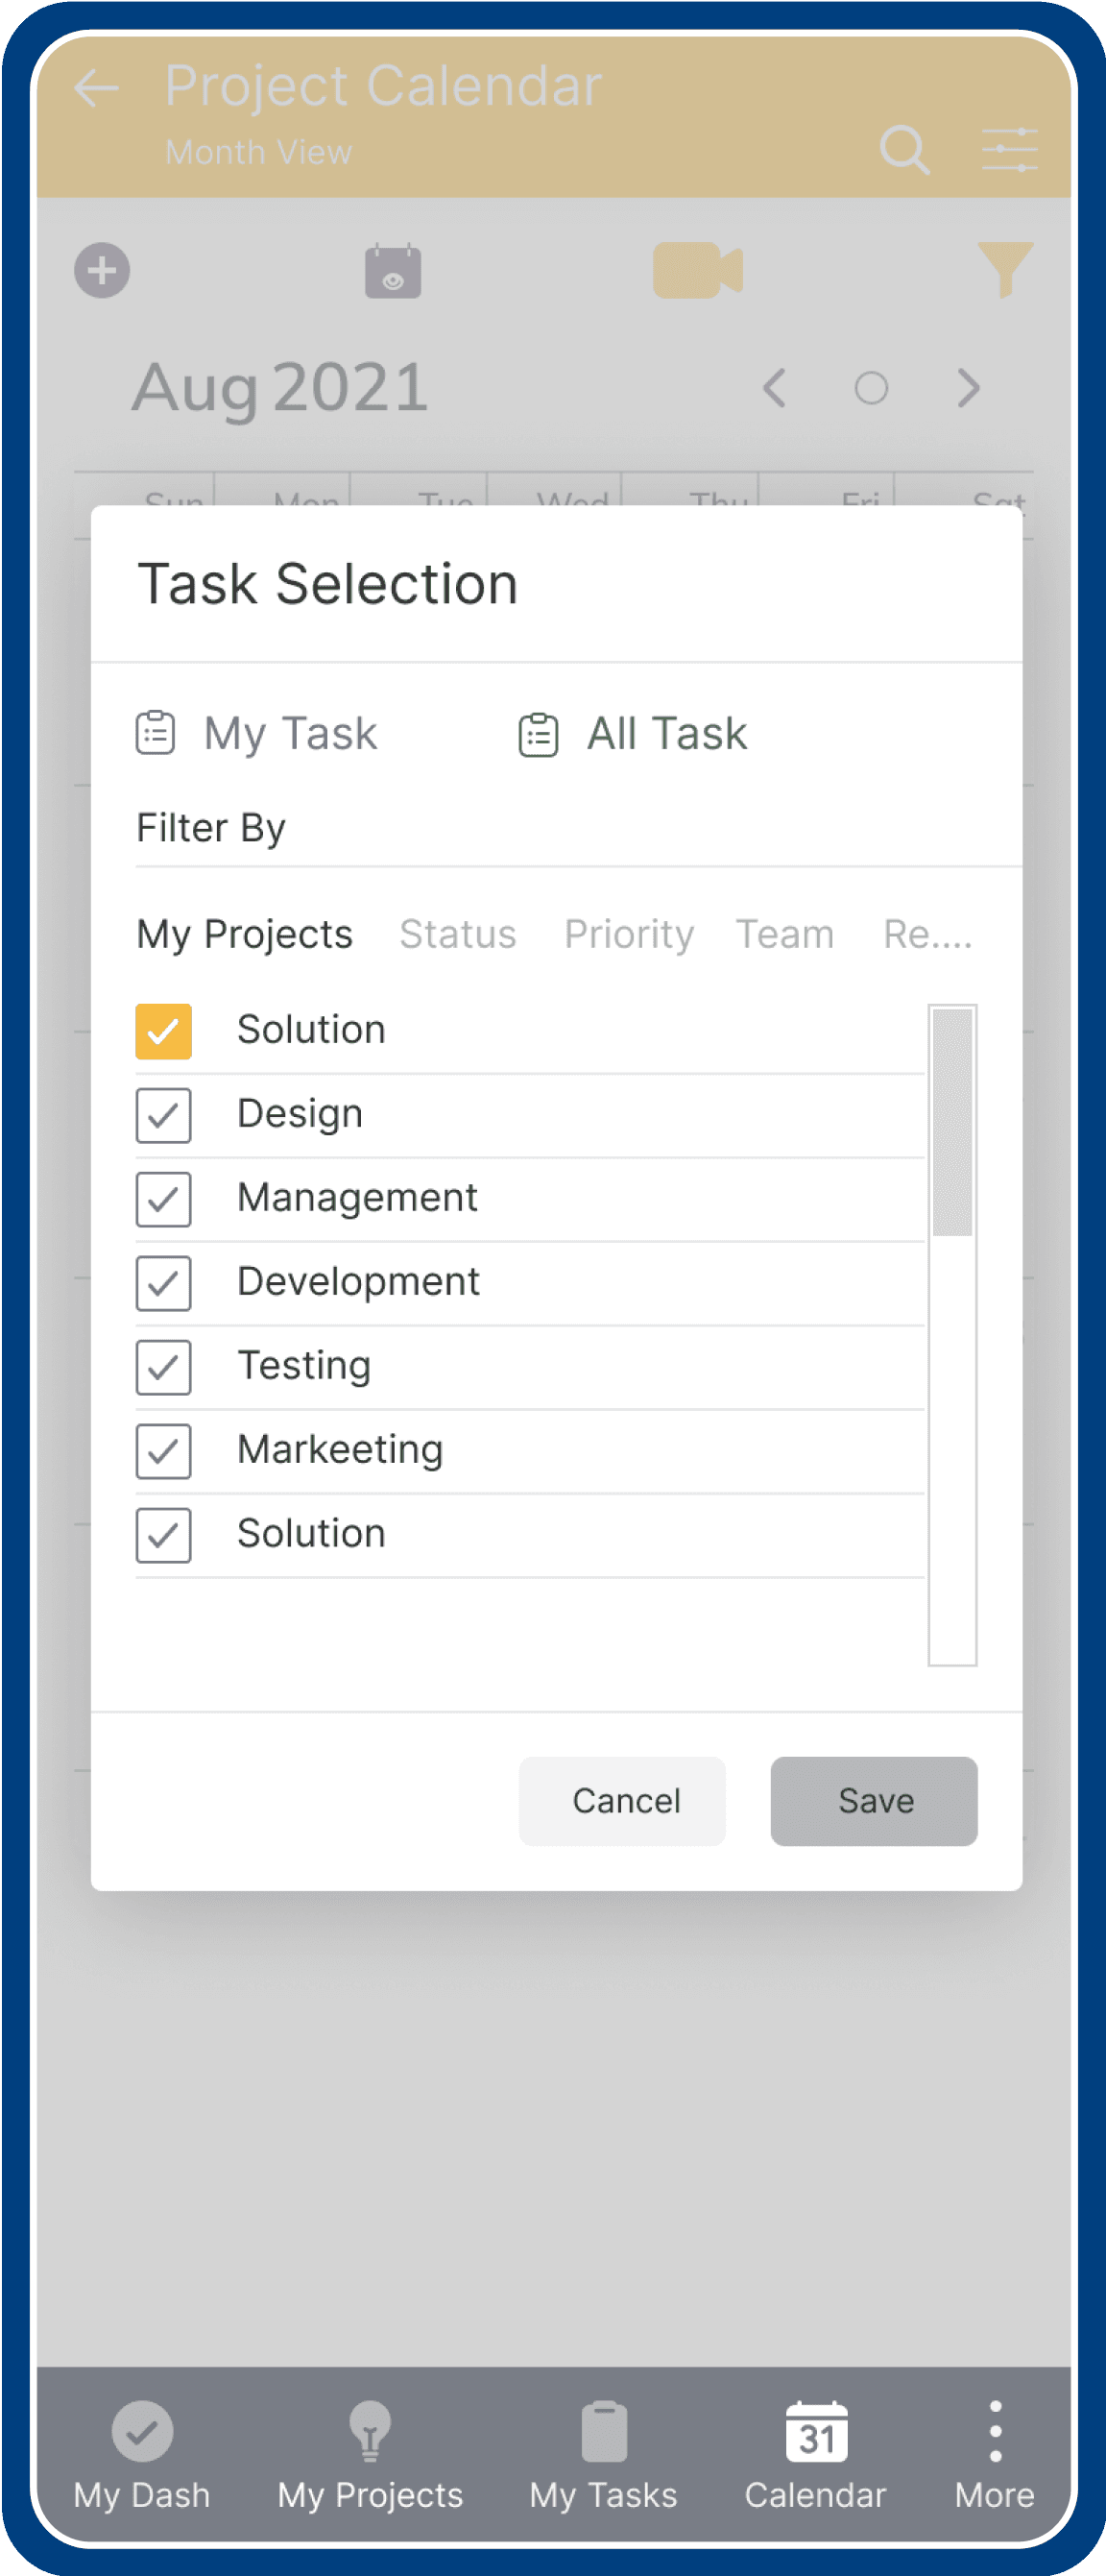
All Task - Team
Conclusion
User Testing
We conducted multiple user tests with internal stakeholders and iterated on the designs.
For Ex: The customization of global & local process type was one of most appreciated feature.
Business and user impact
35% Increase in creating & updating project document.
20% decrease in task completion time.
31% Increase in task success rate.
Takeaways
Reducing the friction in a a process is not simple, you have to compromise on some aspects for final solution.
Analytics was one big task that we worked on. It had many components and details tied together. To nail the UX of all these pieces was not an easy task.
What did I learn?
Data-driven Design is crucial and leads to building very relevant experiences for people.
Thinking about functional & technical aspects and breaking down complexity is core to a Designer's skillset.
A good Designer has bias for action - Fails fast, iterates faster!